Samoan vs Turkish In Labor Force | Age 30-34
COMPARE
Samoan
Turkish
In Labor Force | Age 30-34
In Labor Force | Age 30-34 Comparison
Samoans
Turks
83.3%
IN LABOR FORCE | AGE 30-34
0.0/ 100
METRIC RATING
281st/ 347
METRIC RANK
85.7%
IN LABOR FORCE | AGE 30-34
99.9/ 100
METRIC RATING
40th/ 347
METRIC RANK
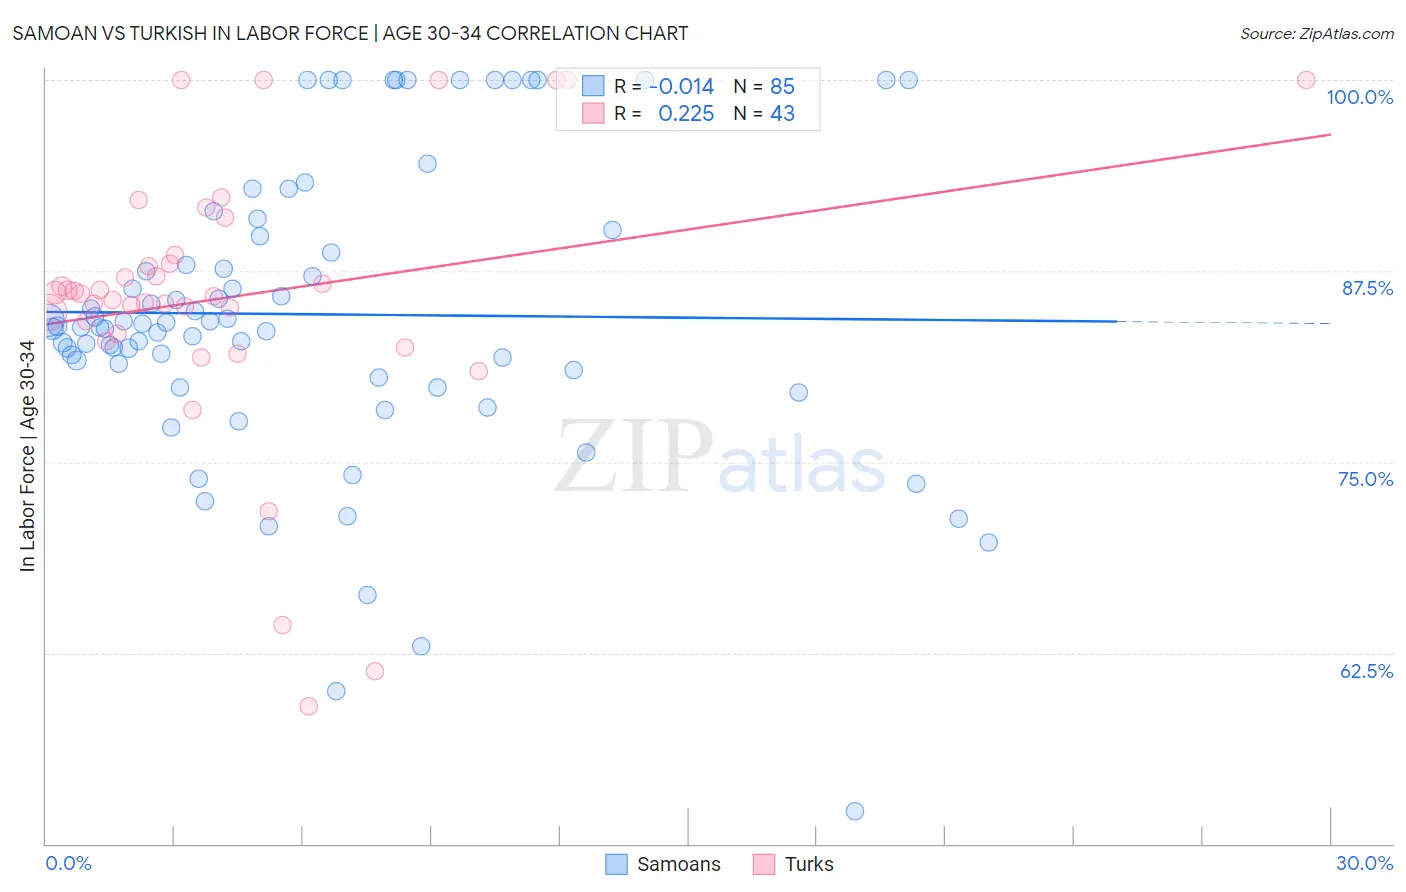
Samoan vs Turkish In Labor Force | Age 30-34 Correlation Chart
The statistical analysis conducted on geographies consisting of 225,110,068 people shows no correlation between the proportion of Samoans and labor force participation rate among population between the ages 30 and 34 in the United States with a correlation coefficient (R) of -0.014 and weighted average of 83.3%. Similarly, the statistical analysis conducted on geographies consisting of 271,716,340 people shows a weak positive correlation between the proportion of Turks and labor force participation rate among population between the ages 30 and 34 in the United States with a correlation coefficient (R) of 0.225 and weighted average of 85.7%, a difference of 2.9%.
In Labor Force | Age 30-34 Correlation Summary
| Measurement | Samoan | Turkish |
| Minimum | 52.1% | 59.0% |
| Maximum | 100.0% | 100.0% |
| Range | 47.9% | 41.0% |
| Mean | 84.7% | 85.8% |
| Median | 83.9% | 86.0% |
| Interquartile 25% (IQ1) | 80.7% | 83.4% |
| Interquartile 75% (IQ3) | 90.0% | 88.6% |
| Interquartile Range (IQR) | 9.2% | 5.1% |
| Standard Deviation (Sample) | 9.8% | 9.1% |
| Standard Deviation (Population) | 9.7% | 9.0% |
Similar Demographics by In Labor Force | Age 30-34
Demographics Similar to Samoans by In Labor Force | Age 30-34
In terms of in labor force | age 30-34, the demographic groups most similar to Samoans are Mexican American Indian (83.2%, a difference of 0.040%), Assyrian/Chaldean/Syriac (83.2%, a difference of 0.050%), Immigrants from Belize (83.2%, a difference of 0.10%), Cree (83.2%, a difference of 0.10%), and African (83.4%, a difference of 0.14%).
| Demographics | Rating | Rank | In Labor Force | Age 30-34 |
| Belizeans | 0.0 /100 | #274 | Tragic 83.5% |
| Immigrants | Grenada | 0.0 /100 | #275 | Tragic 83.5% |
| Tongans | 0.0 /100 | #276 | Tragic 83.5% |
| Delaware | 0.0 /100 | #277 | Tragic 83.5% |
| Fijians | 0.0 /100 | #278 | Tragic 83.4% |
| Immigrants | Fiji | 0.0 /100 | #279 | Tragic 83.4% |
| Africans | 0.0 /100 | #280 | Tragic 83.4% |
| Samoans | 0.0 /100 | #281 | Tragic 83.3% |
| Mexican American Indians | 0.0 /100 | #282 | Tragic 83.2% |
| Assyrians/Chaldeans/Syriacs | 0.0 /100 | #283 | Tragic 83.2% |
| Immigrants | Belize | 0.0 /100 | #284 | Tragic 83.2% |
| Cree | 0.0 /100 | #285 | Tragic 83.2% |
| Immigrants | Latin America | 0.0 /100 | #286 | Tragic 83.1% |
| Native Hawaiians | 0.0 /100 | #287 | Tragic 83.0% |
| Central American Indians | 0.0 /100 | #288 | Tragic 83.0% |
Demographics Similar to Turks by In Labor Force | Age 30-34
In terms of in labor force | age 30-34, the demographic groups most similar to Turks are Immigrants from Italy (85.7%, a difference of 0.030%), Zimbabwean (85.6%, a difference of 0.030%), Eastern European (85.7%, a difference of 0.040%), Immigrants from Lithuania (85.6%, a difference of 0.040%), and Immigrants from Sri Lanka (85.6%, a difference of 0.060%).
| Demographics | Rating | Rank | In Labor Force | Age 30-34 |
| Immigrants | Bosnia and Herzegovina | 99.9 /100 | #33 | Exceptional 85.8% |
| Ugandans | 99.9 /100 | #34 | Exceptional 85.8% |
| Serbians | 99.9 /100 | #35 | Exceptional 85.8% |
| Albanians | 99.9 /100 | #36 | Exceptional 85.7% |
| Norwegians | 99.9 /100 | #37 | Exceptional 85.7% |
| Immigrants | Greece | 99.9 /100 | #38 | Exceptional 85.7% |
| Eastern Europeans | 99.9 /100 | #39 | Exceptional 85.7% |
| Turks | 99.9 /100 | #40 | Exceptional 85.7% |
| Immigrants | Italy | 99.9 /100 | #41 | Exceptional 85.7% |
| Zimbabweans | 99.8 /100 | #42 | Exceptional 85.6% |
| Immigrants | Lithuania | 99.8 /100 | #43 | Exceptional 85.6% |
| Immigrants | Sri Lanka | 99.8 /100 | #44 | Exceptional 85.6% |
| Immigrants | Nepal | 99.8 /100 | #45 | Exceptional 85.6% |
| Immigrants | Morocco | 99.8 /100 | #46 | Exceptional 85.6% |
| Croatians | 99.8 /100 | #47 | Exceptional 85.6% |