Russian vs Immigrants from Germany In Labor Force | Age 45-54
COMPARE
Russian
Immigrants from Germany
In Labor Force | Age 45-54
In Labor Force | Age 45-54 Comparison
Russians
Immigrants from Germany
83.4%
IN LABOR FORCE | AGE 45-54
96.8/ 100
METRIC RATING
76th/ 347
METRIC RANK
82.1%
IN LABOR FORCE | AGE 45-54
2.4/ 100
METRIC RATING
227th/ 347
METRIC RANK
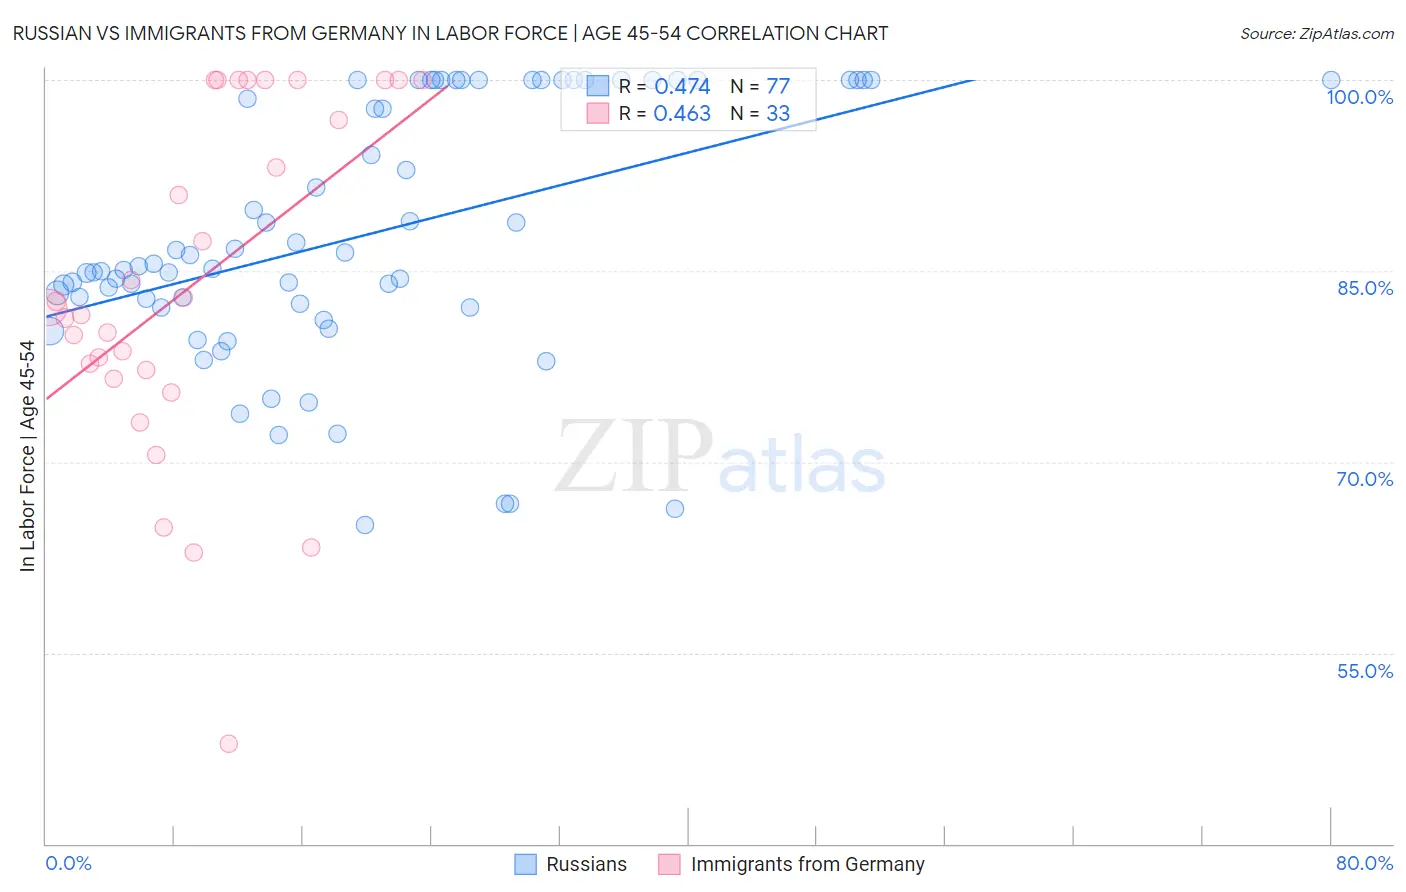
Russian vs Immigrants from Germany In Labor Force | Age 45-54 Correlation Chart
The statistical analysis conducted on geographies consisting of 511,675,657 people shows a moderate positive correlation between the proportion of Russians and labor force participation rate among population between the ages 45 and 54 in the United States with a correlation coefficient (R) of 0.474 and weighted average of 83.4%. Similarly, the statistical analysis conducted on geographies consisting of 463,732,175 people shows a moderate positive correlation between the proportion of Immigrants from Germany and labor force participation rate among population between the ages 45 and 54 in the United States with a correlation coefficient (R) of 0.463 and weighted average of 82.1%, a difference of 1.6%.
In Labor Force | Age 45-54 Correlation Summary
| Measurement | Russian | Immigrants from Germany |
| Minimum | 65.0% | 47.9% |
| Maximum | 100.0% | 100.0% |
| Range | 35.0% | 52.1% |
| Mean | 87.8% | 83.9% |
| Median | 85.3% | 82.1% |
| Interquartile 25% (IQ1) | 82.3% | 76.9% |
| Interquartile 75% (IQ3) | 100.0% | 100.0% |
| Interquartile Range (IQR) | 17.7% | 23.1% |
| Standard Deviation (Sample) | 9.9% | 13.4% |
| Standard Deviation (Population) | 9.9% | 13.2% |
Similar Demographics by In Labor Force | Age 45-54
Demographics Similar to Russians by In Labor Force | Age 45-54
In terms of in labor force | age 45-54, the demographic groups most similar to Russians are Immigrants from Somalia (83.4%, a difference of 0.0%), Estonian (83.4%, a difference of 0.0%), Cuban (83.4%, a difference of 0.010%), Immigrants from Egypt (83.4%, a difference of 0.010%), and Serbian (83.4%, a difference of 0.020%).
| Demographics | Rating | Rank | In Labor Force | Age 45-54 |
| Taiwanese | 97.5 /100 | #69 | Exceptional 83.4% |
| Immigrants | Latvia | 97.4 /100 | #70 | Exceptional 83.4% |
| Colombians | 97.3 /100 | #71 | Exceptional 83.4% |
| Serbians | 97.2 /100 | #72 | Exceptional 83.4% |
| Immigrants | Czechoslovakia | 97.1 /100 | #73 | Exceptional 83.4% |
| Immigrants | Somalia | 96.9 /100 | #74 | Exceptional 83.4% |
| Estonians | 96.9 /100 | #75 | Exceptional 83.4% |
| Russians | 96.8 /100 | #76 | Exceptional 83.4% |
| Cubans | 96.7 /100 | #77 | Exceptional 83.4% |
| Immigrants | Egypt | 96.6 /100 | #78 | Exceptional 83.4% |
| Belgians | 96.5 /100 | #79 | Exceptional 83.4% |
| Immigrants | Croatia | 96.5 /100 | #80 | Exceptional 83.4% |
| Jordanians | 96.4 /100 | #81 | Exceptional 83.4% |
| Immigrants | Eastern Asia | 96.3 /100 | #82 | Exceptional 83.4% |
| Immigrants | Zimbabwe | 96.3 /100 | #83 | Exceptional 83.4% |
Demographics Similar to Immigrants from Germany by In Labor Force | Age 45-54
In terms of in labor force | age 45-54, the demographic groups most similar to Immigrants from Germany are Immigrants from Oceania (82.1%, a difference of 0.010%), Immigrants from Caribbean (82.1%, a difference of 0.010%), Immigrants from Jamaica (82.1%, a difference of 0.030%), Cape Verdean (82.1%, a difference of 0.030%), and Immigrants from Burma/Myanmar (82.0%, a difference of 0.050%).
| Demographics | Rating | Rank | In Labor Force | Age 45-54 |
| Bahamians | 3.6 /100 | #220 | Tragic 82.2% |
| Panamanians | 3.5 /100 | #221 | Tragic 82.2% |
| Immigrants | Ecuador | 3.4 /100 | #222 | Tragic 82.2% |
| Immigrants | Immigrants | 3.1 /100 | #223 | Tragic 82.1% |
| Immigrants | Jamaica | 2.7 /100 | #224 | Tragic 82.1% |
| Immigrants | Oceania | 2.5 /100 | #225 | Tragic 82.1% |
| Immigrants | Caribbean | 2.5 /100 | #226 | Tragic 82.1% |
| Immigrants | Germany | 2.4 /100 | #227 | Tragic 82.1% |
| Cape Verdeans | 2.1 /100 | #228 | Tragic 82.1% |
| Immigrants | Burma/Myanmar | 1.9 /100 | #229 | Tragic 82.0% |
| Jamaicans | 1.8 /100 | #230 | Tragic 82.0% |
| Immigrants | Senegal | 1.7 /100 | #231 | Tragic 82.0% |
| Immigrants | Portugal | 1.7 /100 | #232 | Tragic 82.0% |
| Malaysians | 1.7 /100 | #233 | Tragic 82.0% |
| Salvadorans | 1.7 /100 | #234 | Tragic 82.0% |