Immigrants from Serbia vs Immigrants from Germany In Labor Force | Age 45-54
COMPARE
Immigrants from Serbia
Immigrants from Germany
In Labor Force | Age 45-54
In Labor Force | Age 45-54 Comparison
Immigrants from Serbia
Immigrants from Germany
83.9%
IN LABOR FORCE | AGE 45-54
99.8/ 100
METRIC RATING
26th/ 347
METRIC RANK
82.1%
IN LABOR FORCE | AGE 45-54
2.4/ 100
METRIC RATING
227th/ 347
METRIC RANK
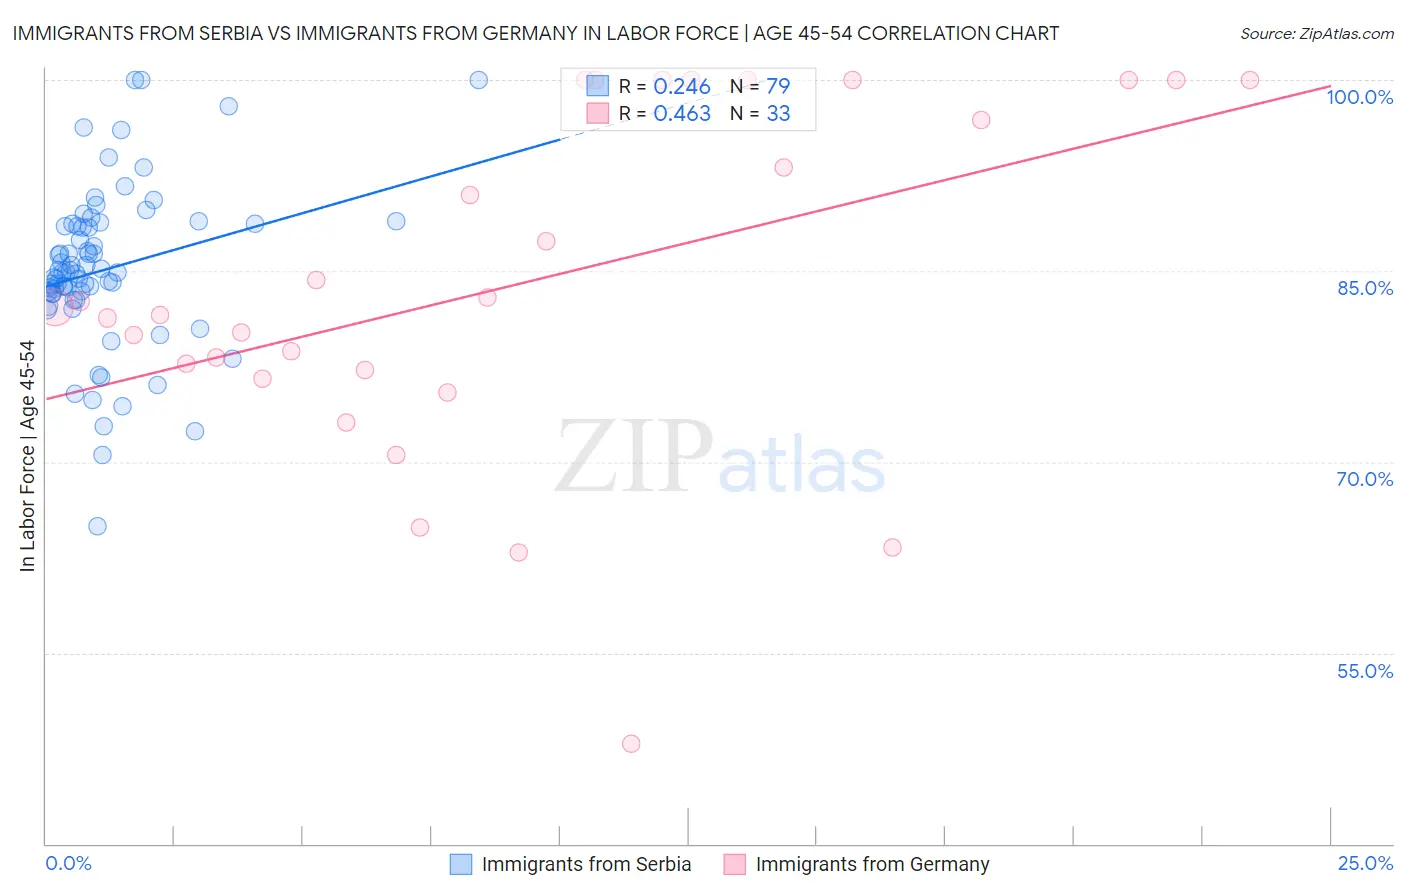
Immigrants from Serbia vs Immigrants from Germany In Labor Force | Age 45-54 Correlation Chart
The statistical analysis conducted on geographies consisting of 131,723,072 people shows a weak positive correlation between the proportion of Immigrants from Serbia and labor force participation rate among population between the ages 45 and 54 in the United States with a correlation coefficient (R) of 0.246 and weighted average of 83.9%. Similarly, the statistical analysis conducted on geographies consisting of 463,732,175 people shows a moderate positive correlation between the proportion of Immigrants from Germany and labor force participation rate among population between the ages 45 and 54 in the United States with a correlation coefficient (R) of 0.463 and weighted average of 82.1%, a difference of 2.2%.
In Labor Force | Age 45-54 Correlation Summary
| Measurement | Immigrants from Serbia | Immigrants from Germany |
| Minimum | 64.9% | 47.9% |
| Maximum | 100.0% | 100.0% |
| Range | 35.1% | 52.1% |
| Mean | 85.1% | 83.9% |
| Median | 84.9% | 82.1% |
| Interquartile 25% (IQ1) | 83.2% | 76.9% |
| Interquartile 75% (IQ3) | 88.7% | 100.0% |
| Interquartile Range (IQR) | 5.5% | 23.1% |
| Standard Deviation (Sample) | 6.4% | 13.4% |
| Standard Deviation (Population) | 6.4% | 13.2% |
Similar Demographics by In Labor Force | Age 45-54
Demographics Similar to Immigrants from Serbia by In Labor Force | Age 45-54
In terms of in labor force | age 45-54, the demographic groups most similar to Immigrants from Serbia are Immigrants from North Macedonia (83.9%, a difference of 0.010%), Immigrants from Brazil (83.9%, a difference of 0.010%), Immigrants from Lithuania (83.9%, a difference of 0.020%), Tlingit-Haida (83.9%, a difference of 0.040%), and Slovene (83.9%, a difference of 0.040%).
| Demographics | Rating | Rank | In Labor Force | Age 45-54 |
| Czechs | 99.8 /100 | #19 | Exceptional 83.9% |
| Immigrants | Eastern Africa | 99.8 /100 | #20 | Exceptional 83.9% |
| Immigrants | Sri Lanka | 99.8 /100 | #21 | Exceptional 83.9% |
| Immigrants | Ireland | 99.8 /100 | #22 | Exceptional 83.9% |
| Tlingit-Haida | 99.8 /100 | #23 | Exceptional 83.9% |
| Slovenes | 99.8 /100 | #24 | Exceptional 83.9% |
| Immigrants | North Macedonia | 99.8 /100 | #25 | Exceptional 83.9% |
| Immigrants | Serbia | 99.8 /100 | #26 | Exceptional 83.9% |
| Immigrants | Brazil | 99.8 /100 | #27 | Exceptional 83.9% |
| Immigrants | Lithuania | 99.8 /100 | #28 | Exceptional 83.9% |
| Immigrants | Pakistan | 99.7 /100 | #29 | Exceptional 83.8% |
| Immigrants | Bulgaria | 99.7 /100 | #30 | Exceptional 83.8% |
| Immigrants | Eritrea | 99.7 /100 | #31 | Exceptional 83.8% |
| Turks | 99.7 /100 | #32 | Exceptional 83.8% |
| Latvians | 99.7 /100 | #33 | Exceptional 83.8% |
Demographics Similar to Immigrants from Germany by In Labor Force | Age 45-54
In terms of in labor force | age 45-54, the demographic groups most similar to Immigrants from Germany are Immigrants from Oceania (82.1%, a difference of 0.010%), Immigrants from Caribbean (82.1%, a difference of 0.010%), Immigrants from Jamaica (82.1%, a difference of 0.030%), Cape Verdean (82.1%, a difference of 0.030%), and Immigrants from Burma/Myanmar (82.0%, a difference of 0.050%).
| Demographics | Rating | Rank | In Labor Force | Age 45-54 |
| Bahamians | 3.6 /100 | #220 | Tragic 82.2% |
| Panamanians | 3.5 /100 | #221 | Tragic 82.2% |
| Immigrants | Ecuador | 3.4 /100 | #222 | Tragic 82.2% |
| Immigrants | Immigrants | 3.1 /100 | #223 | Tragic 82.1% |
| Immigrants | Jamaica | 2.7 /100 | #224 | Tragic 82.1% |
| Immigrants | Oceania | 2.5 /100 | #225 | Tragic 82.1% |
| Immigrants | Caribbean | 2.5 /100 | #226 | Tragic 82.1% |
| Immigrants | Germany | 2.4 /100 | #227 | Tragic 82.1% |
| Cape Verdeans | 2.1 /100 | #228 | Tragic 82.1% |
| Immigrants | Burma/Myanmar | 1.9 /100 | #229 | Tragic 82.0% |
| Jamaicans | 1.8 /100 | #230 | Tragic 82.0% |
| Immigrants | Senegal | 1.7 /100 | #231 | Tragic 82.0% |
| Immigrants | Portugal | 1.7 /100 | #232 | Tragic 82.0% |
| Malaysians | 1.7 /100 | #233 | Tragic 82.0% |
| Salvadorans | 1.7 /100 | #234 | Tragic 82.0% |