Russian vs Immigrants from Germany Unemployment Among Youth under 25 years
COMPARE
Russian
Immigrants from Germany
Unemployment Among Youth under 25 years
Unemployment Among Youth under 25 years Comparison
Russians
Immigrants from Germany
11.6%
UNEMPLOYMENT AMONG YOUTH UNDER 25 YEARS
57.3/ 100
METRIC RATING
170th/ 347
METRIC RANK
11.5%
UNEMPLOYMENT AMONG YOUTH UNDER 25 YEARS
65.9/ 100
METRIC RATING
156th/ 347
METRIC RANK
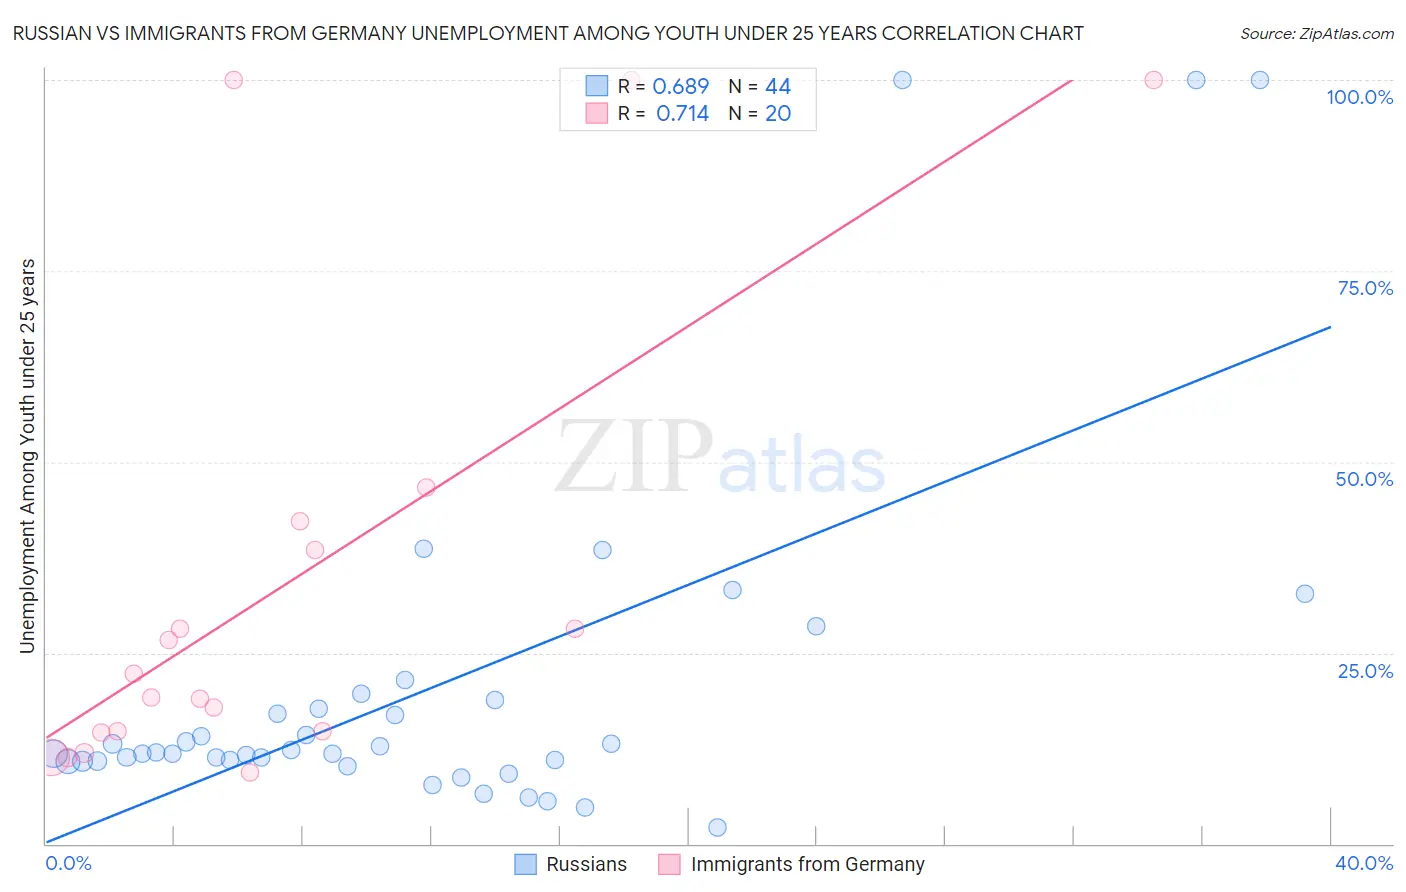
Russian vs Immigrants from Germany Unemployment Among Youth under 25 years Correlation Chart
The statistical analysis conducted on geographies consisting of 498,069,374 people shows a significant positive correlation between the proportion of Russians and unemployment rate among youth under the age of 25 in the United States with a correlation coefficient (R) of 0.689 and weighted average of 11.6%. Similarly, the statistical analysis conducted on geographies consisting of 454,799,121 people shows a strong positive correlation between the proportion of Immigrants from Germany and unemployment rate among youth under the age of 25 in the United States with a correlation coefficient (R) of 0.714 and weighted average of 11.5%, a difference of 0.38%.
Unemployment Among Youth under 25 years Correlation Summary
| Measurement | Russian | Immigrants from Germany |
| Minimum | 2.1% | 9.3% |
| Maximum | 100.0% | 100.0% |
| Range | 97.9% | 90.7% |
| Mean | 20.4% | 33.8% |
| Median | 11.9% | 20.7% |
| Interquartile 25% (IQ1) | 10.8% | 14.7% |
| Interquartile 75% (IQ3) | 18.3% | 40.3% |
| Interquartile Range (IQR) | 7.4% | 25.7% |
| Standard Deviation (Sample) | 23.3% | 30.4% |
| Standard Deviation (Population) | 23.0% | 29.6% |
Demographics Similar to Russians and Immigrants from Germany by Unemployment Among Youth under 25 years
In terms of unemployment among youth under 25 years, the demographic groups most similar to Russians are Eastern European (11.6%, a difference of 0.010%), Potawatomi (11.6%, a difference of 0.020%), Okinawan (11.6%, a difference of 0.060%), Bangladeshi (11.6%, a difference of 0.070%), and Immigrants from Morocco (11.6%, a difference of 0.090%). Similarly, the demographic groups most similar to Immigrants from Germany are Immigrants from Romania (11.5%, a difference of 0.020%), Indian (Asian) (11.5%, a difference of 0.030%), Immigrants from Asia (11.5%, a difference of 0.040%), Immigrants from Turkey (11.5%, a difference of 0.050%), and Immigrants from Western Europe (11.5%, a difference of 0.050%).
| Demographics | Rating | Rank | Unemployment Among Youth under 25 years |
| Immigrants | Czechoslovakia | 67.1 /100 | #153 | Good 11.5% |
| Immigrants | Asia | 66.7 /100 | #154 | Good 11.5% |
| Immigrants | Romania | 66.3 /100 | #155 | Good 11.5% |
| Immigrants | Germany | 65.9 /100 | #156 | Good 11.5% |
| Indians (Asian) | 65.1 /100 | #157 | Good 11.5% |
| Immigrants | Turkey | 64.8 /100 | #158 | Good 11.5% |
| Immigrants | Western Europe | 64.7 /100 | #159 | Good 11.5% |
| Immigrants | Eastern Asia | 64.5 /100 | #160 | Good 11.5% |
| Ukrainians | 64.3 /100 | #161 | Good 11.5% |
| Immigrants | Northern Africa | 62.7 /100 | #162 | Good 11.5% |
| Immigrants | Kazakhstan | 62.7 /100 | #163 | Good 11.5% |
| Immigrants | Laos | 62.4 /100 | #164 | Good 11.5% |
| Immigrants | Sweden | 61.3 /100 | #165 | Good 11.5% |
| Spanish | 60.3 /100 | #166 | Good 11.6% |
| Okinawans | 58.7 /100 | #167 | Average 11.6% |
| Potawatomi | 57.9 /100 | #168 | Average 11.6% |
| Eastern Europeans | 57.5 /100 | #169 | Average 11.6% |
| Russians | 57.3 /100 | #170 | Average 11.6% |
| Bangladeshis | 55.6 /100 | #171 | Average 11.6% |
| Immigrants | Morocco | 55.1 /100 | #172 | Average 11.6% |
| Immigrants | South Eastern Asia | 51.7 /100 | #173 | Average 11.6% |