Puget Sound Salish vs Pueblo In Labor Force | Age 16-19
COMPARE
Puget Sound Salish
Pueblo
In Labor Force | Age 16-19
In Labor Force | Age 16-19 Comparison
Puget Sound Salish
Pueblo
39.1%
IN LABOR FORCE | AGE 16-19
99.6/ 100
METRIC RATING
88th/ 347
METRIC RANK
34.9%
IN LABOR FORCE | AGE 16-19
2.6/ 100
METRIC RATING
243rd/ 347
METRIC RANK
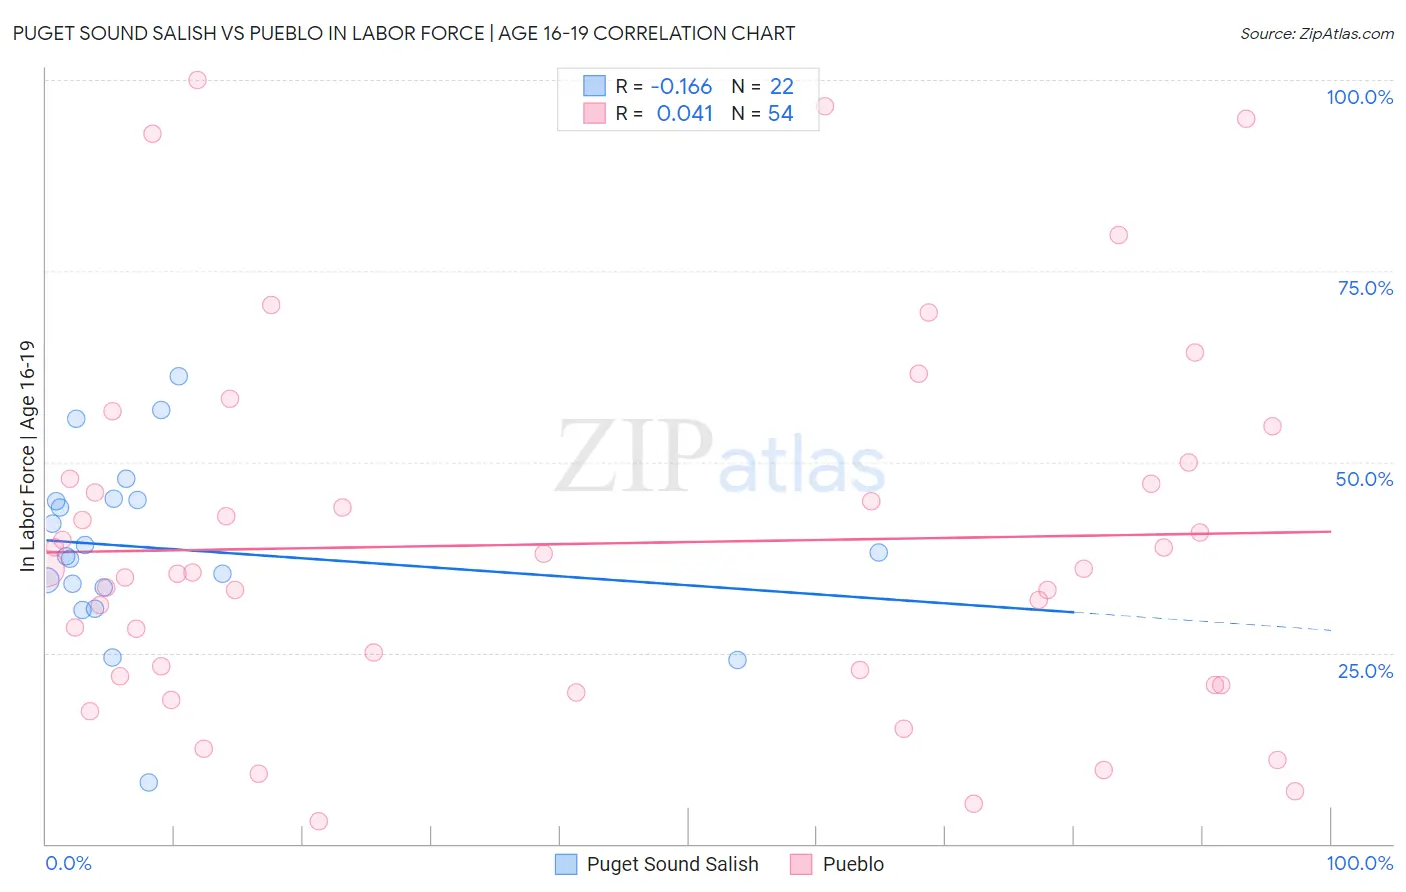
Puget Sound Salish vs Pueblo In Labor Force | Age 16-19 Correlation Chart
The statistical analysis conducted on geographies consisting of 46,131,142 people shows a poor negative correlation between the proportion of Puget Sound Salish and labor force participation rate among population between the ages 16 and 19 in the United States with a correlation coefficient (R) of -0.166 and weighted average of 39.1%. Similarly, the statistical analysis conducted on geographies consisting of 119,984,829 people shows no correlation between the proportion of Pueblo and labor force participation rate among population between the ages 16 and 19 in the United States with a correlation coefficient (R) of 0.041 and weighted average of 34.9%, a difference of 12.0%.
In Labor Force | Age 16-19 Correlation Summary
| Measurement | Puget Sound Salish | Pueblo |
| Minimum | 8.1% | 3.0% |
| Maximum | 61.2% | 100.0% |
| Range | 53.1% | 97.0% |
| Mean | 38.6% | 39.3% |
| Median | 37.8% | 35.8% |
| Interquartile 25% (IQ1) | 33.5% | 21.9% |
| Interquartile 75% (IQ3) | 45.0% | 47.8% |
| Interquartile Range (IQR) | 11.5% | 25.9% |
| Standard Deviation (Sample) | 11.8% | 23.7% |
| Standard Deviation (Population) | 11.5% | 23.5% |
Similar Demographics by In Labor Force | Age 16-19
Demographics Similar to Puget Sound Salish by In Labor Force | Age 16-19
In terms of in labor force | age 16-19, the demographic groups most similar to Puget Sound Salish are Alaska Native (39.1%, a difference of 0.010%), Immigrants from Germany (39.1%, a difference of 0.070%), Immigrants from Burma/Myanmar (39.0%, a difference of 0.090%), Samoan (39.1%, a difference of 0.16%), and Creek (39.1%, a difference of 0.17%).
| Demographics | Rating | Rank | In Labor Force | Age 16-19 |
| Shoshone | 99.7 /100 | #81 | Exceptional 39.3% |
| Basques | 99.7 /100 | #82 | Exceptional 39.3% |
| Spanish | 99.7 /100 | #83 | Exceptional 39.3% |
| Immigrants | Uganda | 99.7 /100 | #84 | Exceptional 39.2% |
| Creek | 99.6 /100 | #85 | Exceptional 39.1% |
| Samoans | 99.6 /100 | #86 | Exceptional 39.1% |
| Immigrants | Germany | 99.6 /100 | #87 | Exceptional 39.1% |
| Puget Sound Salish | 99.6 /100 | #88 | Exceptional 39.1% |
| Alaska Natives | 99.6 /100 | #89 | Exceptional 39.1% |
| Immigrants | Burma/Myanmar | 99.5 /100 | #90 | Exceptional 39.0% |
| Spanish Americans | 99.5 /100 | #91 | Exceptional 39.0% |
| Osage | 99.4 /100 | #92 | Exceptional 39.0% |
| Blackfeet | 99.4 /100 | #93 | Exceptional 38.9% |
| Immigrants | Canada | 99.4 /100 | #94 | Exceptional 38.9% |
| Immigrants | North America | 99.4 /100 | #95 | Exceptional 38.9% |
Demographics Similar to Pueblo by In Labor Force | Age 16-19
In terms of in labor force | age 16-19, the demographic groups most similar to Pueblo are Immigrants from Turkey (34.9%, a difference of 0.020%), Uruguayan (34.9%, a difference of 0.030%), Immigrants from Greece (34.9%, a difference of 0.080%), Immigrants from Sri Lanka (34.9%, a difference of 0.10%), and Laotian (34.9%, a difference of 0.11%).
| Demographics | Rating | Rank | In Labor Force | Age 16-19 |
| Immigrants | Australia | 3.6 /100 | #236 | Tragic 35.1% |
| Immigrants | India | 3.5 /100 | #237 | Tragic 35.0% |
| Immigrants | Vietnam | 3.4 /100 | #238 | Tragic 35.0% |
| Inupiat | 3.2 /100 | #239 | Tragic 35.0% |
| Immigrants | Central America | 3.0 /100 | #240 | Tragic 35.0% |
| Immigrants | Ireland | 2.9 /100 | #241 | Tragic 35.0% |
| Uruguayans | 2.6 /100 | #242 | Tragic 34.9% |
| Pueblo | 2.6 /100 | #243 | Tragic 34.9% |
| Immigrants | Turkey | 2.6 /100 | #244 | Tragic 34.9% |
| Immigrants | Greece | 2.4 /100 | #245 | Tragic 34.9% |
| Immigrants | Sri Lanka | 2.4 /100 | #246 | Tragic 34.9% |
| Laotians | 2.4 /100 | #247 | Tragic 34.9% |
| Central Americans | 2.2 /100 | #248 | Tragic 34.8% |
| Immigrants | Ukraine | 2.2 /100 | #249 | Tragic 34.8% |
| Immigrants | Pakistan | 2.0 /100 | #250 | Tragic 34.8% |