Cheyenne vs Hispanic or Latino In Labor Force | Age 25-29
COMPARE
Cheyenne
Hispanic or Latino
In Labor Force | Age 25-29
In Labor Force | Age 25-29 Comparison
Cheyenne
Hispanics or Latinos
80.3%
IN LABOR FORCE | AGE 25-29
0.0/ 100
METRIC RATING
331st/ 347
METRIC RANK
82.2%
IN LABOR FORCE | AGE 25-29
0.0/ 100
METRIC RATING
312th/ 347
METRIC RANK
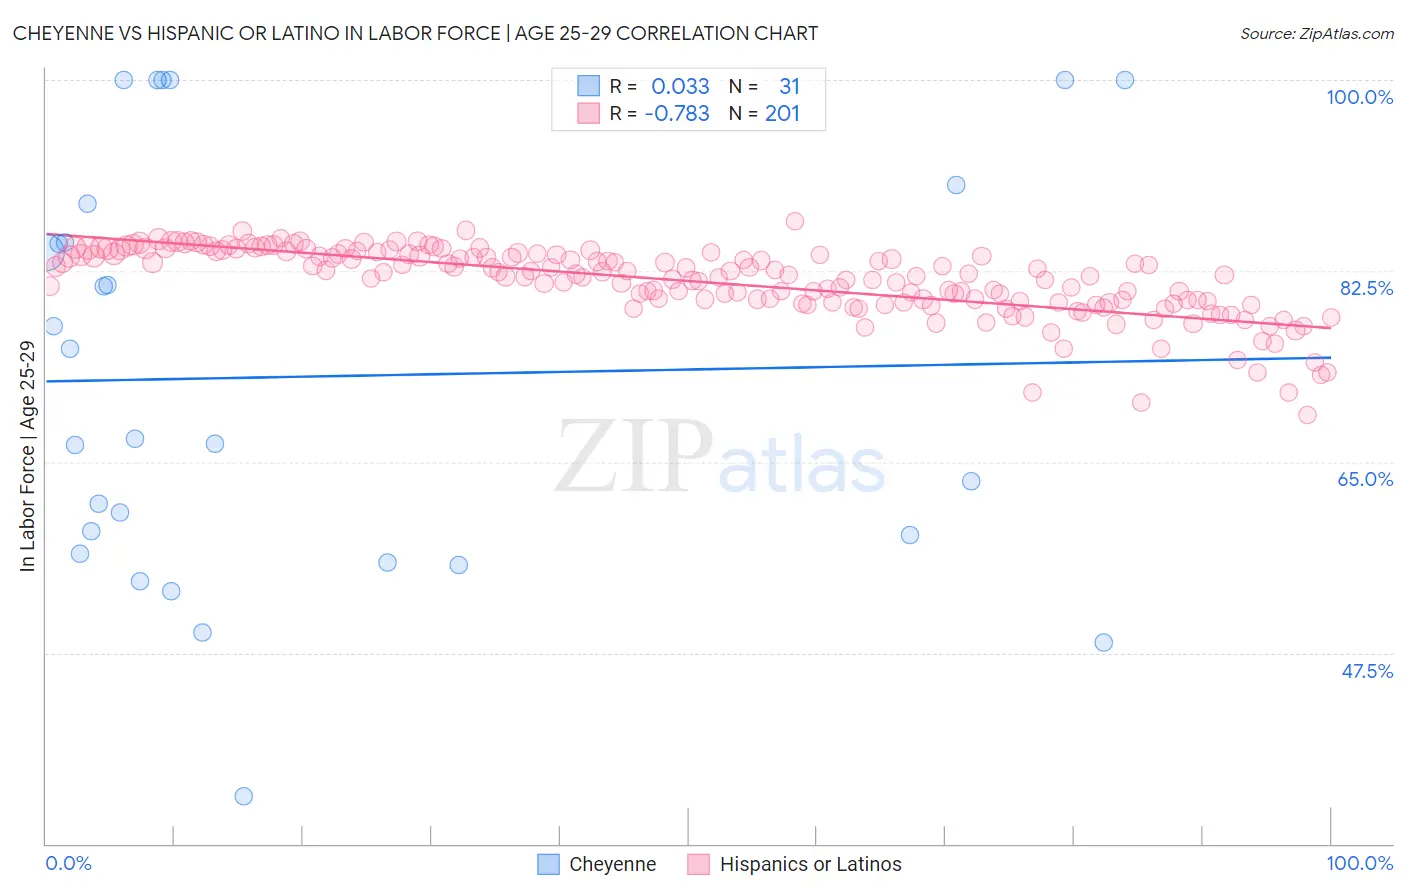
Cheyenne vs Hispanic or Latino In Labor Force | Age 25-29 Correlation Chart
The statistical analysis conducted on geographies consisting of 80,678,314 people shows no correlation between the proportion of Cheyenne and labor force participation rate among population between the ages 25 and 29 in the United States with a correlation coefficient (R) of 0.033 and weighted average of 80.3%. Similarly, the statistical analysis conducted on geographies consisting of 577,042,190 people shows a strong negative correlation between the proportion of Hispanics or Latinos and labor force participation rate among population between the ages 25 and 29 in the United States with a correlation coefficient (R) of -0.783 and weighted average of 82.2%, a difference of 2.4%.
In Labor Force | Age 25-29 Correlation Summary
| Measurement | Cheyenne | Hispanic or Latino |
| Minimum | 34.3% | 69.3% |
| Maximum | 100.0% | 87.0% |
| Range | 65.7% | 17.7% |
| Mean | 72.8% | 81.6% |
| Median | 67.1% | 82.2% |
| Interquartile 25% (IQ1) | 56.6% | 79.7% |
| Interquartile 75% (IQ3) | 88.6% | 84.1% |
| Interquartile Range (IQR) | 32.0% | 4.4% |
| Standard Deviation (Sample) | 18.9% | 3.2% |
| Standard Deviation (Population) | 18.6% | 3.2% |
Demographics Similar to Cheyenne and Hispanics or Latinos by In Labor Force | Age 25-29
In terms of in labor force | age 25-29, the demographic groups most similar to Cheyenne are Puerto Rican (80.4%, a difference of 0.14%), Yakama (80.6%, a difference of 0.37%), Creek (80.7%, a difference of 0.48%), Ute (80.8%, a difference of 0.62%), and Choctaw (81.0%, a difference of 0.83%). Similarly, the demographic groups most similar to Hispanics or Latinos are Alaskan Athabascan (82.3%, a difference of 0.070%), Yaqui (82.2%, a difference of 0.10%), Cherokee (82.1%, a difference of 0.14%), Immigrants from Mexico (82.0%, a difference of 0.28%), and Mexican (81.9%, a difference of 0.36%).
| Demographics | Rating | Rank | In Labor Force | Age 25-29 |
| Alaskan Athabascans | 0.0 /100 | #311 | Tragic 82.3% |
| Hispanics or Latinos | 0.0 /100 | #312 | Tragic 82.2% |
| Yaqui | 0.0 /100 | #313 | Tragic 82.2% |
| Cherokee | 0.0 /100 | #314 | Tragic 82.1% |
| Immigrants | Mexico | 0.0 /100 | #315 | Tragic 82.0% |
| Mexicans | 0.0 /100 | #316 | Tragic 81.9% |
| Chickasaw | 0.0 /100 | #317 | Tragic 81.9% |
| Comanche | 0.0 /100 | #318 | Tragic 81.9% |
| Seminole | 0.0 /100 | #319 | Tragic 81.7% |
| Colville | 0.0 /100 | #320 | Tragic 81.6% |
| Shoshone | 0.0 /100 | #321 | Tragic 81.6% |
| Kiowa | 0.0 /100 | #322 | Tragic 81.6% |
| Alaska Natives | 0.0 /100 | #323 | Tragic 81.6% |
| Houma | 0.0 /100 | #324 | Tragic 81.2% |
| Dutch West Indians | 0.0 /100 | #325 | Tragic 81.1% |
| Choctaw | 0.0 /100 | #326 | Tragic 81.0% |
| Ute | 0.0 /100 | #327 | Tragic 80.8% |
| Creek | 0.0 /100 | #328 | Tragic 80.7% |
| Yakama | 0.0 /100 | #329 | Tragic 80.6% |
| Puerto Ricans | 0.0 /100 | #330 | Tragic 80.4% |
| Cheyenne | 0.0 /100 | #331 | Tragic 80.3% |