Peruvian vs Pueblo In Labor Force | Age 30-34
COMPARE
Peruvian
Pueblo
In Labor Force | Age 30-34
In Labor Force | Age 30-34 Comparison
Peruvians
Pueblo
84.8%
IN LABOR FORCE | AGE 30-34
65.9/ 100
METRIC RATING
157th/ 347
METRIC RANK
80.0%
IN LABOR FORCE | AGE 30-34
0.0/ 100
METRIC RATING
330th/ 347
METRIC RANK
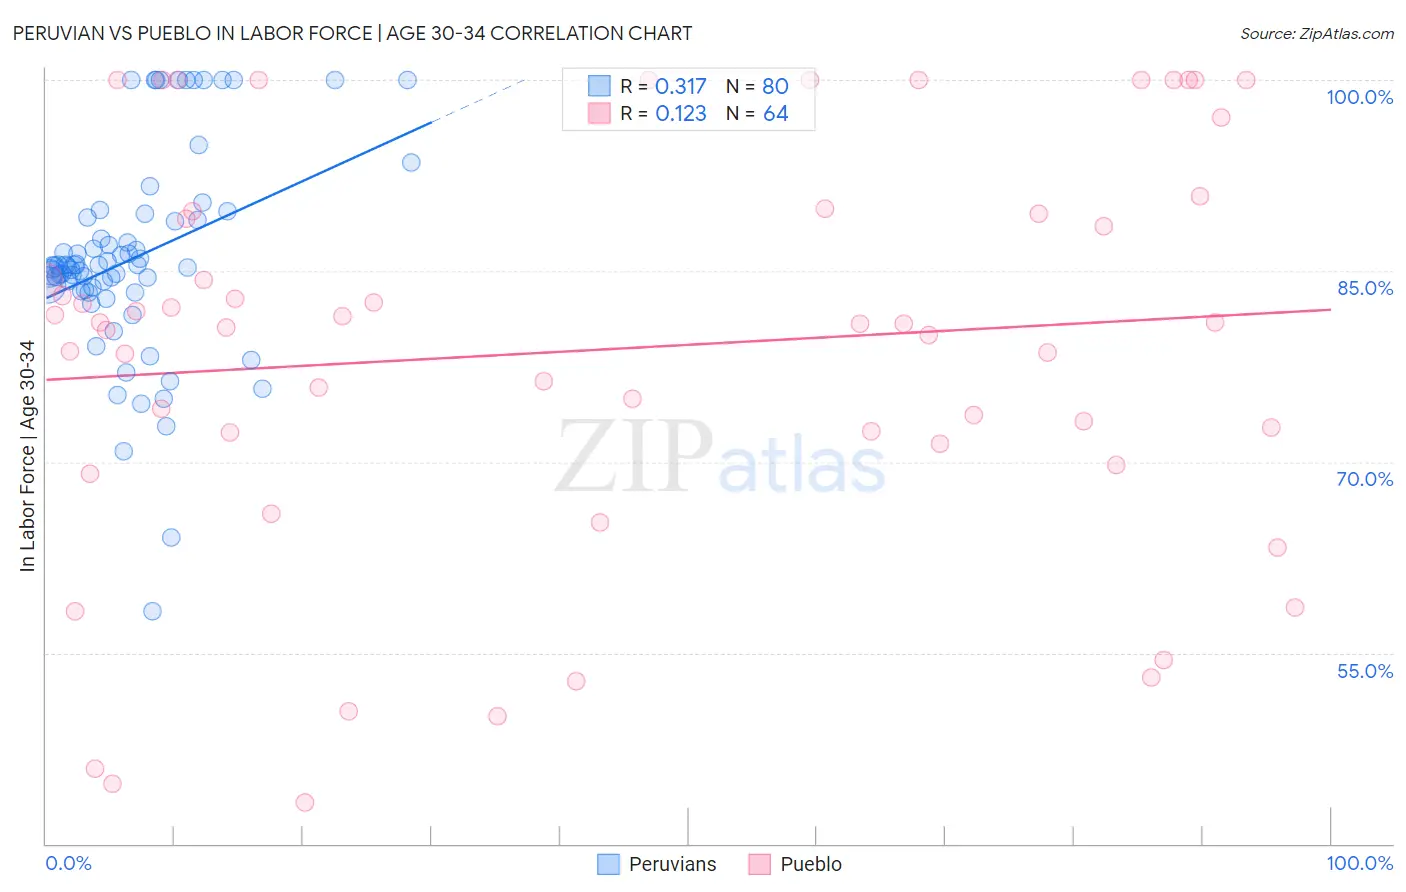
Peruvian vs Pueblo In Labor Force | Age 30-34 Correlation Chart
The statistical analysis conducted on geographies consisting of 363,011,511 people shows a mild positive correlation between the proportion of Peruvians and labor force participation rate among population between the ages 30 and 34 in the United States with a correlation coefficient (R) of 0.317 and weighted average of 84.8%. Similarly, the statistical analysis conducted on geographies consisting of 120,059,209 people shows a poor positive correlation between the proportion of Pueblo and labor force participation rate among population between the ages 30 and 34 in the United States with a correlation coefficient (R) of 0.123 and weighted average of 80.0%, a difference of 5.9%.
In Labor Force | Age 30-34 Correlation Summary
| Measurement | Peruvian | Pueblo |
| Minimum | 58.3% | 43.2% |
| Maximum | 100.0% | 100.0% |
| Range | 41.7% | 56.8% |
| Mean | 86.0% | 78.8% |
| Median | 85.3% | 80.9% |
| Interquartile 25% (IQ1) | 83.5% | 71.9% |
| Interquartile 75% (IQ3) | 89.1% | 89.6% |
| Interquartile Range (IQR) | 5.6% | 17.8% |
| Standard Deviation (Sample) | 8.1% | 15.7% |
| Standard Deviation (Population) | 8.1% | 15.6% |
Similar Demographics by In Labor Force | Age 30-34
Demographics Similar to Peruvians by In Labor Force | Age 30-34
In terms of in labor force | age 30-34, the demographic groups most similar to Peruvians are French Canadian (84.8%, a difference of 0.010%), Immigrants from Armenia (84.8%, a difference of 0.010%), Czechoslovakian (84.8%, a difference of 0.020%), Syrian (84.8%, a difference of 0.030%), and Northern European (84.8%, a difference of 0.030%).
| Demographics | Rating | Rank | In Labor Force | Age 30-34 |
| Germans | 75.1 /100 | #150 | Good 84.8% |
| Immigrants | Senegal | 74.0 /100 | #151 | Good 84.8% |
| Romanians | 73.5 /100 | #152 | Good 84.8% |
| Syrians | 70.1 /100 | #153 | Good 84.8% |
| Northern Europeans | 70.0 /100 | #154 | Good 84.8% |
| Immigrants | Sudan | 69.5 /100 | #155 | Good 84.8% |
| French Canadians | 67.3 /100 | #156 | Good 84.8% |
| Peruvians | 65.9 /100 | #157 | Good 84.8% |
| Immigrants | Armenia | 64.7 /100 | #158 | Good 84.8% |
| Czechoslovakians | 63.0 /100 | #159 | Good 84.8% |
| Pakistanis | 60.8 /100 | #160 | Good 84.7% |
| Immigrants | Cambodia | 60.7 /100 | #161 | Good 84.7% |
| South Americans | 58.7 /100 | #162 | Average 84.7% |
| Immigrants | Uruguay | 57.4 /100 | #163 | Average 84.7% |
| Icelanders | 56.8 /100 | #164 | Average 84.7% |
Demographics Similar to Pueblo by In Labor Force | Age 30-34
In terms of in labor force | age 30-34, the demographic groups most similar to Pueblo are Houma (79.9%, a difference of 0.17%), Kiowa (79.8%, a difference of 0.28%), Creek (80.4%, a difference of 0.40%), Inupiat (79.7%, a difference of 0.40%), and Sioux (80.4%, a difference of 0.41%).
| Demographics | Rating | Rank | In Labor Force | Age 30-34 |
| Paiute | 0.0 /100 | #323 | Tragic 81.2% |
| Cheyenne | 0.0 /100 | #324 | Tragic 81.1% |
| Dutch West Indians | 0.0 /100 | #325 | Tragic 81.0% |
| Seminole | 0.0 /100 | #326 | Tragic 80.8% |
| Colville | 0.0 /100 | #327 | Tragic 80.7% |
| Sioux | 0.0 /100 | #328 | Tragic 80.4% |
| Creek | 0.0 /100 | #329 | Tragic 80.4% |
| Pueblo | 0.0 /100 | #330 | Tragic 80.0% |
| Houma | 0.0 /100 | #331 | Tragic 79.9% |
| Kiowa | 0.0 /100 | #332 | Tragic 79.8% |
| Inupiat | 0.0 /100 | #333 | Tragic 79.7% |
| Hopi | 0.0 /100 | #334 | Tragic 79.3% |
| Marshallese | 0.0 /100 | #335 | Tragic 79.2% |
| Natives/Alaskans | 0.0 /100 | #336 | Tragic 79.2% |
| Yakama | 0.0 /100 | #337 | Tragic 79.1% |