Pennsylvania German vs Immigrants from El Salvador Professional Degree
COMPARE
Pennsylvania German
Immigrants from El Salvador
Professional Degree
Professional Degree Comparison
Pennsylvania Germans
Immigrants from El Salvador
3.0%
PROFESSIONAL DEGREE
0.0/ 100
METRIC RATING
334th/ 347
METRIC RANK
3.5%
PROFESSIONAL DEGREE
0.3/ 100
METRIC RATING
287th/ 347
METRIC RANK
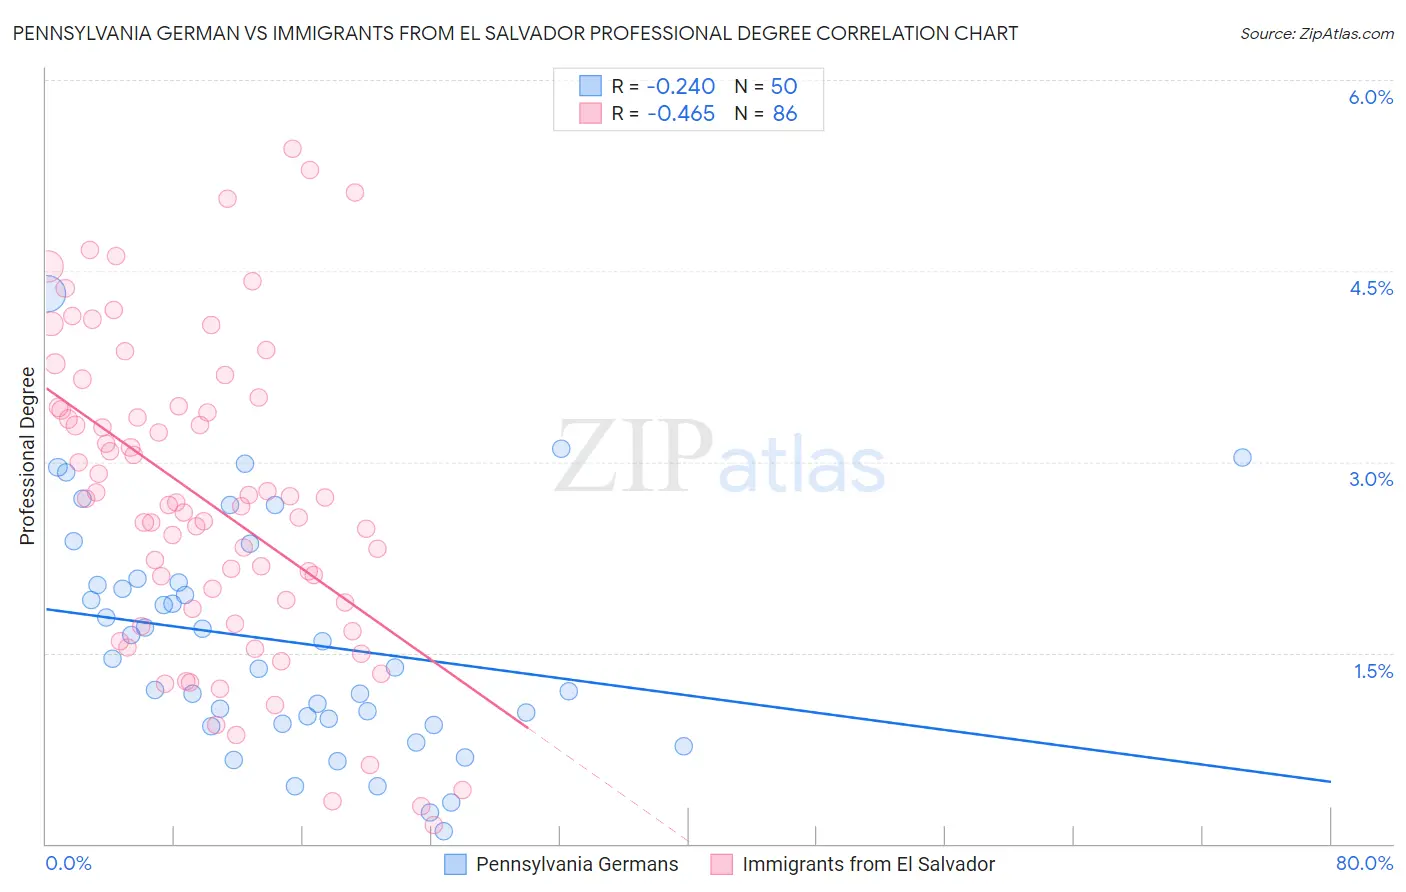
Pennsylvania German vs Immigrants from El Salvador Professional Degree Correlation Chart
The statistical analysis conducted on geographies consisting of 233,026,471 people shows a weak negative correlation between the proportion of Pennsylvania Germans and percentage of population with at least professional degree education in the United States with a correlation coefficient (R) of -0.240 and weighted average of 3.0%. Similarly, the statistical analysis conducted on geographies consisting of 356,542,562 people shows a moderate negative correlation between the proportion of Immigrants from El Salvador and percentage of population with at least professional degree education in the United States with a correlation coefficient (R) of -0.465 and weighted average of 3.5%, a difference of 17.0%.
Professional Degree Correlation Summary
| Measurement | Pennsylvania German | Immigrants from El Salvador |
| Minimum | 0.10% | 0.14% |
| Maximum | 4.3% | 5.5% |
| Range | 4.2% | 5.3% |
| Mean | 1.6% | 2.7% |
| Median | 1.4% | 2.7% |
| Interquartile 25% (IQ1) | 0.94% | 1.8% |
| Interquartile 75% (IQ3) | 2.0% | 3.4% |
| Interquartile Range (IQR) | 1.1% | 1.6% |
| Standard Deviation (Sample) | 0.90% | 1.2% |
| Standard Deviation (Population) | 0.89% | 1.2% |
Similar Demographics by Professional Degree
Demographics Similar to Pennsylvania Germans by Professional Degree
In terms of professional degree, the demographic groups most similar to Pennsylvania Germans are Native/Alaskan (3.0%, a difference of 0.56%), Fijian (2.9%, a difference of 1.6%), Arapaho (2.9%, a difference of 3.4%), Navajo (2.9%, a difference of 3.5%), and Immigrants from Central America (2.9%, a difference of 3.6%).
| Demographics | Rating | Rank | Professional Degree |
| Dutch West Indians | 0.0 /100 | #327 | Tragic 3.1% |
| Creek | 0.0 /100 | #328 | Tragic 3.1% |
| Bangladeshis | 0.0 /100 | #329 | Tragic 3.1% |
| Immigrants | Cabo Verde | 0.0 /100 | #330 | Tragic 3.1% |
| Kiowa | 0.0 /100 | #331 | Tragic 3.1% |
| Yakama | 0.0 /100 | #332 | Tragic 3.1% |
| Puget Sound Salish | 0.0 /100 | #333 | Tragic 3.1% |
| Pennsylvania Germans | 0.0 /100 | #334 | Tragic 3.0% |
| Natives/Alaskans | 0.0 /100 | #335 | Tragic 3.0% |
| Fijians | 0.0 /100 | #336 | Tragic 2.9% |
| Arapaho | 0.0 /100 | #337 | Tragic 2.9% |
| Navajo | 0.0 /100 | #338 | Tragic 2.9% |
| Immigrants | Central America | 0.0 /100 | #339 | Tragic 2.9% |
| Yup'ik | 0.0 /100 | #340 | Tragic 2.9% |
| Tohono O'odham | 0.0 /100 | #341 | Tragic 2.8% |
Demographics Similar to Immigrants from El Salvador by Professional Degree
In terms of professional degree, the demographic groups most similar to Immigrants from El Salvador are Blackfeet (3.5%, a difference of 0.050%), Haitian (3.5%, a difference of 0.10%), Guatemalan (3.5%, a difference of 0.22%), Chippewa (3.5%, a difference of 0.23%), and Alaska Native (3.5%, a difference of 0.41%).
| Demographics | Rating | Rank | Professional Degree |
| Dominicans | 0.5 /100 | #280 | Tragic 3.5% |
| Apache | 0.5 /100 | #281 | Tragic 3.5% |
| Immigrants | Caribbean | 0.5 /100 | #282 | Tragic 3.5% |
| Comanche | 0.4 /100 | #283 | Tragic 3.5% |
| Salvadorans | 0.4 /100 | #284 | Tragic 3.5% |
| Hondurans | 0.3 /100 | #285 | Tragic 3.5% |
| Haitians | 0.3 /100 | #286 | Tragic 3.5% |
| Immigrants | El Salvador | 0.3 /100 | #287 | Tragic 3.5% |
| Blackfeet | 0.3 /100 | #288 | Tragic 3.5% |
| Guatemalans | 0.3 /100 | #289 | Tragic 3.5% |
| Chippewa | 0.3 /100 | #290 | Tragic 3.5% |
| Alaska Natives | 0.3 /100 | #291 | Tragic 3.5% |
| Immigrants | Belize | 0.3 /100 | #292 | Tragic 3.5% |
| Immigrants | Honduras | 0.3 /100 | #293 | Tragic 3.5% |
| Paiute | 0.3 /100 | #294 | Tragic 3.4% |