Apache vs Bahamian In Labor Force | Age 35-44
COMPARE
Apache
Bahamian
In Labor Force | Age 35-44
In Labor Force | Age 35-44 Comparison
Apache
Bahamians
77.9%
IN LABOR FORCE | AGE 35-44
0.0/ 100
METRIC RATING
337th/ 347
METRIC RANK
84.7%
IN LABOR FORCE | AGE 35-44
93.2/ 100
METRIC RATING
115th/ 347
METRIC RANK
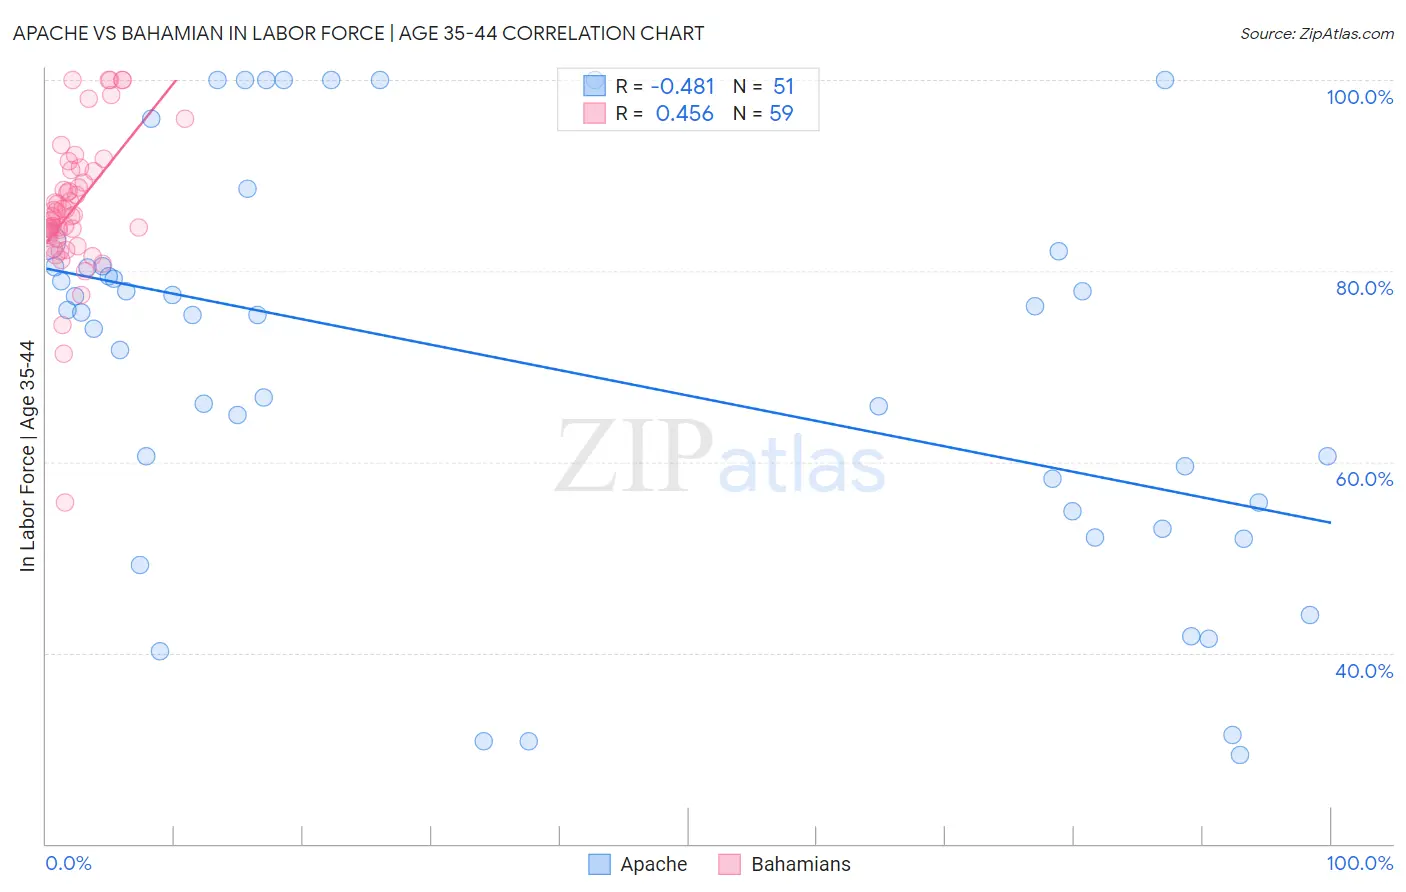
Apache vs Bahamian In Labor Force | Age 35-44 Correlation Chart
The statistical analysis conducted on geographies consisting of 231,077,330 people shows a moderate negative correlation between the proportion of Apache and labor force participation rate among population between the ages 35 and 44 in the United States with a correlation coefficient (R) of -0.481 and weighted average of 77.9%. Similarly, the statistical analysis conducted on geographies consisting of 112,616,837 people shows a moderate positive correlation between the proportion of Bahamians and labor force participation rate among population between the ages 35 and 44 in the United States with a correlation coefficient (R) of 0.456 and weighted average of 84.7%, a difference of 8.8%.
In Labor Force | Age 35-44 Correlation Summary
| Measurement | Apache | Bahamian |
| Minimum | 29.3% | 55.7% |
| Maximum | 100.0% | 100.0% |
| Range | 70.7% | 44.3% |
| Mean | 70.1% | 86.6% |
| Median | 75.4% | 85.7% |
| Interquartile 25% (IQ1) | 54.8% | 83.7% |
| Interquartile 75% (IQ3) | 80.5% | 90.4% |
| Interquartile Range (IQR) | 25.7% | 6.7% |
| Standard Deviation (Sample) | 20.6% | 7.4% |
| Standard Deviation (Population) | 20.4% | 7.3% |
Similar Demographics by In Labor Force | Age 35-44
Demographics Similar to Apache by In Labor Force | Age 35-44
In terms of in labor force | age 35-44, the demographic groups most similar to Apache are Arapaho (78.1%, a difference of 0.21%), Pueblo (77.4%, a difference of 0.70%), Yup'ik (77.3%, a difference of 0.81%), Lumbee (77.0%, a difference of 1.2%), and Hopi (77.0%, a difference of 1.2%).
| Demographics | Rating | Rank | In Labor Force | Age 35-44 |
| Cheyenne | 0.0 /100 | #330 | Tragic 79.5% |
| Houma | 0.0 /100 | #331 | Tragic 79.5% |
| Ute | 0.0 /100 | #332 | Tragic 79.4% |
| Kiowa | 0.0 /100 | #333 | Tragic 79.2% |
| Yakama | 0.0 /100 | #334 | Tragic 79.0% |
| Natives/Alaskans | 0.0 /100 | #335 | Tragic 78.9% |
| Arapaho | 0.0 /100 | #336 | Tragic 78.1% |
| Apache | 0.0 /100 | #337 | Tragic 77.9% |
| Pueblo | 0.0 /100 | #338 | Tragic 77.4% |
| Yup'ik | 0.0 /100 | #339 | Tragic 77.3% |
| Lumbee | 0.0 /100 | #340 | Tragic 77.0% |
| Hopi | 0.0 /100 | #341 | Tragic 77.0% |
| Crow | 0.0 /100 | #342 | Tragic 76.5% |
| Immigrants | Yemen | 0.0 /100 | #343 | Tragic 76.3% |
| Pima | 0.0 /100 | #344 | Tragic 74.8% |
Demographics Similar to Bahamians by In Labor Force | Age 35-44
In terms of in labor force | age 35-44, the demographic groups most similar to Bahamians are Immigrants from Western Africa (84.7%, a difference of 0.0%), Uruguayan (84.7%, a difference of 0.0%), Chilean (84.7%, a difference of 0.0%), Ukrainian (84.7%, a difference of 0.010%), and Immigrants from Egypt (84.7%, a difference of 0.010%).
| Demographics | Rating | Rank | In Labor Force | Age 35-44 |
| Immigrants | Argentina | 94.5 /100 | #108 | Exceptional 84.8% |
| Immigrants | Russia | 94.5 /100 | #109 | Exceptional 84.8% |
| Filipinos | 93.8 /100 | #110 | Exceptional 84.7% |
| Ukrainians | 93.5 /100 | #111 | Exceptional 84.7% |
| Immigrants | Western Africa | 93.4 /100 | #112 | Exceptional 84.7% |
| Uruguayans | 93.3 /100 | #113 | Exceptional 84.7% |
| Chileans | 93.2 /100 | #114 | Exceptional 84.7% |
| Bahamians | 93.2 /100 | #115 | Exceptional 84.7% |
| Immigrants | Egypt | 92.7 /100 | #116 | Exceptional 84.7% |
| Immigrants | China | 92.3 /100 | #117 | Exceptional 84.7% |
| Immigrants | Eastern Asia | 92.1 /100 | #118 | Exceptional 84.7% |
| Burmese | 91.8 /100 | #119 | Exceptional 84.7% |
| Immigrants | Northern Europe | 91.5 /100 | #120 | Exceptional 84.7% |
| Finns | 91.2 /100 | #121 | Exceptional 84.7% |
| Germans | 91.0 /100 | #122 | Exceptional 84.7% |