Okinawan vs Czechoslovakian In Labor Force | Age 45-54
COMPARE
Okinawan
Czechoslovakian
In Labor Force | Age 45-54
In Labor Force | Age 45-54 Comparison
Okinawans
Czechoslovakians
83.0%
IN LABOR FORCE | AGE 45-54
77.0/ 100
METRIC RATING
143rd/ 347
METRIC RANK
83.0%
IN LABOR FORCE | AGE 45-54
74.8/ 100
METRIC RATING
147th/ 347
METRIC RANK
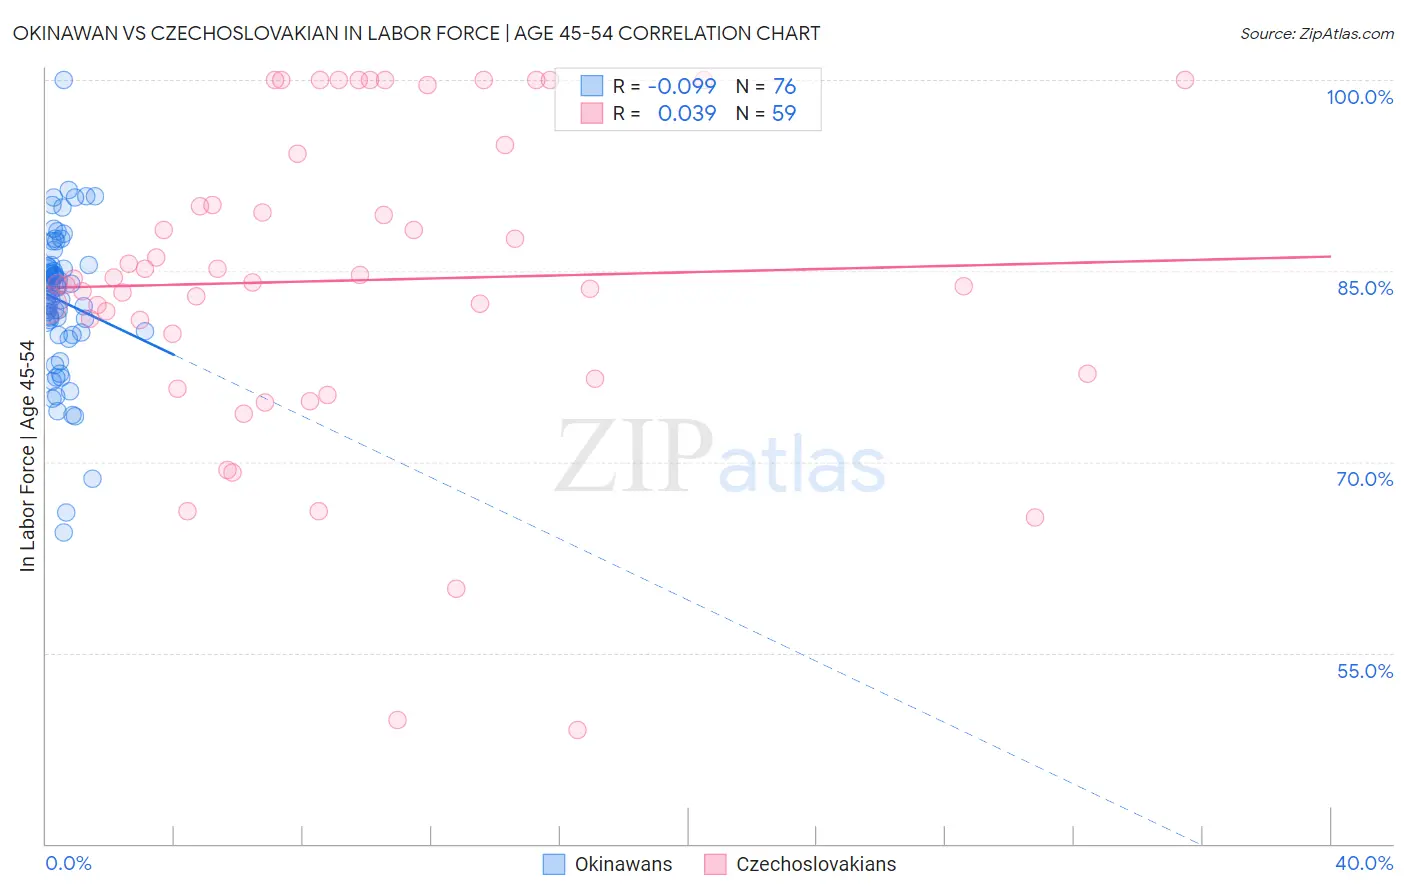
Okinawan vs Czechoslovakian In Labor Force | Age 45-54 Correlation Chart
The statistical analysis conducted on geographies consisting of 73,729,827 people shows a slight negative correlation between the proportion of Okinawans and labor force participation rate among population between the ages 45 and 54 in the United States with a correlation coefficient (R) of -0.099 and weighted average of 83.0%. Similarly, the statistical analysis conducted on geographies consisting of 368,521,801 people shows no correlation between the proportion of Czechoslovakians and labor force participation rate among population between the ages 45 and 54 in the United States with a correlation coefficient (R) of 0.039 and weighted average of 83.0%, a difference of 0.030%.
In Labor Force | Age 45-54 Correlation Summary
| Measurement | Okinawan | Czechoslovakian |
| Minimum | 64.5% | 48.9% |
| Maximum | 100.0% | 100.0% |
| Range | 35.5% | 51.1% |
| Mean | 82.7% | 84.2% |
| Median | 83.6% | 84.1% |
| Interquartile 25% (IQ1) | 80.2% | 76.9% |
| Interquartile 75% (IQ3) | 85.3% | 94.2% |
| Interquartile Range (IQR) | 5.1% | 17.3% |
| Standard Deviation (Sample) | 5.8% | 12.2% |
| Standard Deviation (Population) | 5.7% | 12.1% |
Demographics Similar to Okinawans and Czechoslovakians by In Labor Force | Age 45-54
In terms of in labor force | age 45-54, the demographic groups most similar to Okinawans are Soviet Union (83.0%, a difference of 0.0%), Immigrants from Haiti (83.0%, a difference of 0.010%), Immigrants from Scotland (83.0%, a difference of 0.010%), Scandinavian (83.0%, a difference of 0.020%), and Yugoslavian (83.0%, a difference of 0.020%). Similarly, the demographic groups most similar to Czechoslovakians are Romanian (83.0%, a difference of 0.010%), Immigrants from France (83.0%, a difference of 0.010%), Immigrants from Nigeria (83.0%, a difference of 0.010%), Soviet Union (83.0%, a difference of 0.020%), and Immigrants from Sweden (82.9%, a difference of 0.020%).
| Demographics | Rating | Rank | In Labor Force | Age 45-54 |
| Austrians | 81.3 /100 | #135 | Excellent 83.0% |
| Immigrants | Kazakhstan | 81.0 /100 | #136 | Excellent 83.0% |
| Immigrants | Spain | 80.4 /100 | #137 | Excellent 83.0% |
| Ghanaians | 79.5 /100 | #138 | Good 83.0% |
| Scandinavians | 78.5 /100 | #139 | Good 83.0% |
| Yugoslavians | 78.3 /100 | #140 | Good 83.0% |
| Immigrants | Haiti | 77.9 /100 | #141 | Good 83.0% |
| Immigrants | Scotland | 77.8 /100 | #142 | Good 83.0% |
| Okinawans | 77.0 /100 | #143 | Good 83.0% |
| Soviet Union | 76.8 /100 | #144 | Good 83.0% |
| Romanians | 75.4 /100 | #145 | Good 83.0% |
| Immigrants | France | 75.3 /100 | #146 | Good 83.0% |
| Czechoslovakians | 74.8 /100 | #147 | Good 83.0% |
| Immigrants | Nigeria | 74.1 /100 | #148 | Good 83.0% |
| Immigrants | Sweden | 73.3 /100 | #149 | Good 82.9% |
| Immigrants | Netherlands | 72.6 /100 | #150 | Good 82.9% |
| Koreans | 71.9 /100 | #151 | Good 82.9% |
| Slavs | 71.5 /100 | #152 | Good 82.9% |
| Immigrants | Indonesia | 70.6 /100 | #153 | Good 82.9% |
| Immigrants | Ghana | 70.3 /100 | #154 | Good 82.9% |
| Immigrants | Philippines | 69.0 /100 | #155 | Good 82.9% |