Native/Alaskan vs Finnish In Labor Force | Age 30-34
COMPARE
Native/Alaskan
Finnish
In Labor Force | Age 30-34
In Labor Force | Age 30-34 Comparison
Natives/Alaskans
Finns
79.2%
IN LABOR FORCE | AGE 30-34
0.0/ 100
METRIC RATING
336th/ 347
METRIC RANK
84.7%
IN LABOR FORCE | AGE 30-34
50.0/ 100
METRIC RATING
174th/ 347
METRIC RANK
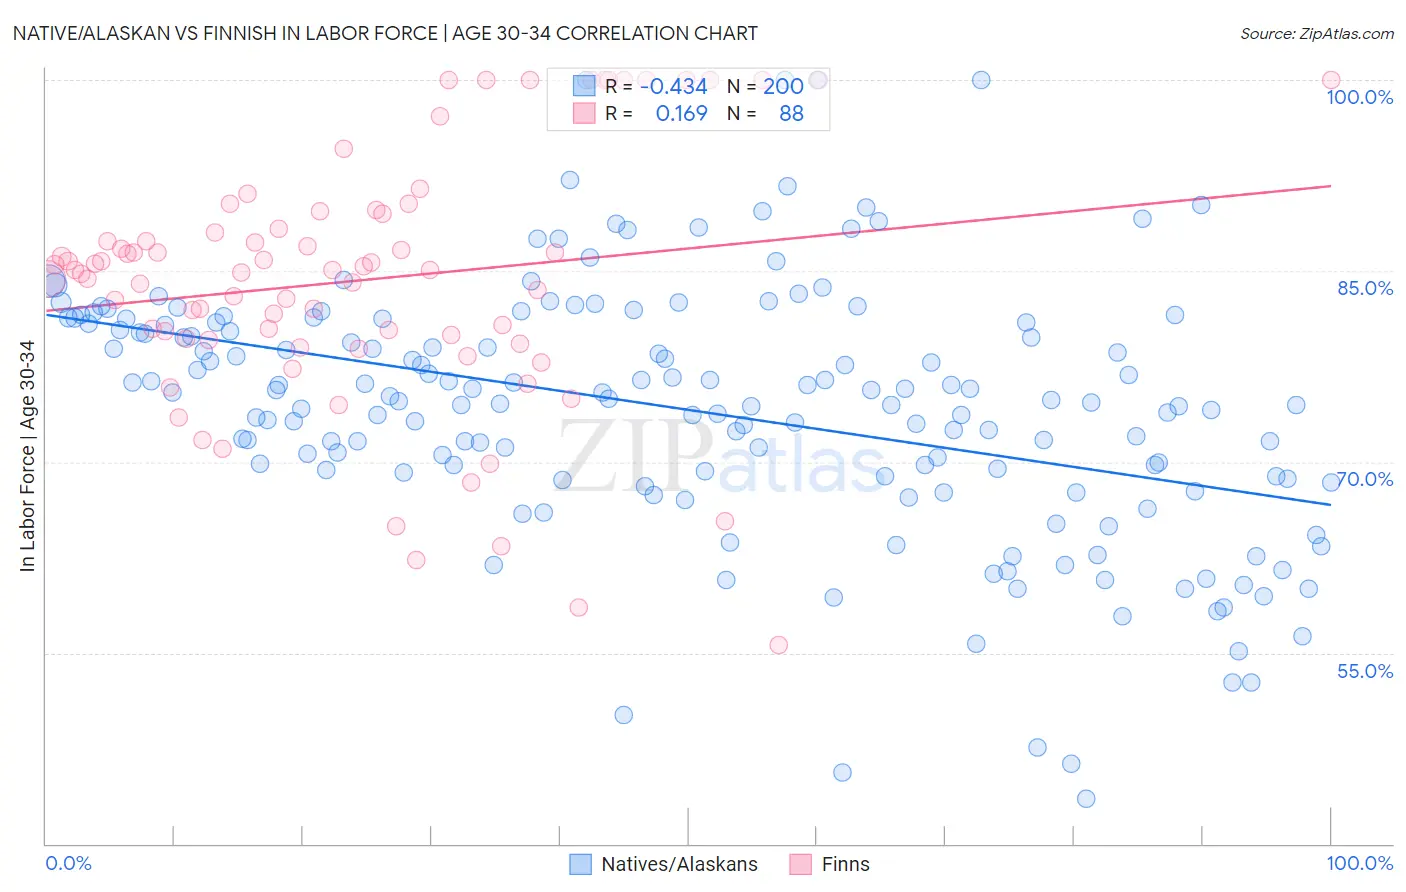
Native/Alaskan vs Finnish In Labor Force | Age 30-34 Correlation Chart
The statistical analysis conducted on geographies consisting of 512,461,419 people shows a moderate negative correlation between the proportion of Natives/Alaskans and labor force participation rate among population between the ages 30 and 34 in the United States with a correlation coefficient (R) of -0.434 and weighted average of 79.2%. Similarly, the statistical analysis conducted on geographies consisting of 404,404,222 people shows a poor positive correlation between the proportion of Finns and labor force participation rate among population between the ages 30 and 34 in the United States with a correlation coefficient (R) of 0.169 and weighted average of 84.7%, a difference of 7.0%.
In Labor Force | Age 30-34 Correlation Summary
| Measurement | Native/Alaskan | Finnish |
| Minimum | 43.5% | 55.6% |
| Maximum | 100.0% | 100.0% |
| Range | 56.5% | 44.4% |
| Mean | 74.1% | 84.2% |
| Median | 74.8% | 85.1% |
| Interquartile 25% (IQ1) | 68.9% | 79.7% |
| Interquartile 75% (IQ3) | 80.9% | 88.9% |
| Interquartile Range (IQR) | 12.0% | 9.2% |
| Standard Deviation (Sample) | 10.0% | 9.9% |
| Standard Deviation (Population) | 10.0% | 9.9% |
Similar Demographics by In Labor Force | Age 30-34
Demographics Similar to Natives/Alaskans by In Labor Force | Age 30-34
In terms of in labor force | age 30-34, the demographic groups most similar to Natives/Alaskans are Yakama (79.1%, a difference of 0.040%), Marshallese (79.2%, a difference of 0.080%), Hopi (79.3%, a difference of 0.12%), Pima (79.0%, a difference of 0.16%), and Apache (79.0%, a difference of 0.19%).
| Demographics | Rating | Rank | In Labor Force | Age 30-34 |
| Creek | 0.0 /100 | #329 | Tragic 80.4% |
| Pueblo | 0.0 /100 | #330 | Tragic 80.0% |
| Houma | 0.0 /100 | #331 | Tragic 79.9% |
| Kiowa | 0.0 /100 | #332 | Tragic 79.8% |
| Inupiat | 0.0 /100 | #333 | Tragic 79.7% |
| Hopi | 0.0 /100 | #334 | Tragic 79.3% |
| Marshallese | 0.0 /100 | #335 | Tragic 79.2% |
| Natives/Alaskans | 0.0 /100 | #336 | Tragic 79.2% |
| Yakama | 0.0 /100 | #337 | Tragic 79.1% |
| Pima | 0.0 /100 | #338 | Tragic 79.0% |
| Apache | 0.0 /100 | #339 | Tragic 79.0% |
| Ute | 0.0 /100 | #340 | Tragic 78.9% |
| Immigrants | Yemen | 0.0 /100 | #341 | Tragic 78.2% |
| Tohono O'odham | 0.0 /100 | #342 | Tragic 77.7% |
| Lumbee | 0.0 /100 | #343 | Tragic 77.3% |
Demographics Similar to Finns by In Labor Force | Age 30-34
In terms of in labor force | age 30-34, the demographic groups most similar to Finns are Immigrants from South America (84.7%, a difference of 0.0%), Immigrants from Burma/Myanmar (84.7%, a difference of 0.010%), Irish (84.7%, a difference of 0.010%), Immigrants from England (84.7%, a difference of 0.010%), and Israeli (84.7%, a difference of 0.010%).
| Demographics | Rating | Rank | In Labor Force | Age 30-34 |
| Immigrants | South Eastern Asia | 54.2 /100 | #167 | Average 84.7% |
| Immigrants | Peru | 52.4 /100 | #168 | Average 84.7% |
| South American Indians | 52.1 /100 | #169 | Average 84.7% |
| Immigrants | Burma/Myanmar | 52.0 /100 | #170 | Average 84.7% |
| Irish | 52.0 /100 | #171 | Average 84.7% |
| Immigrants | England | 51.7 /100 | #172 | Average 84.7% |
| Israelis | 51.1 /100 | #173 | Average 84.7% |
| Finns | 50.0 /100 | #174 | Average 84.7% |
| Immigrants | South America | 50.0 /100 | #175 | Average 84.7% |
| Immigrants | Uzbekistan | 49.1 /100 | #176 | Average 84.7% |
| Laotians | 46.9 /100 | #177 | Average 84.7% |
| Okinawans | 44.1 /100 | #178 | Average 84.6% |
| Immigrants | Nigeria | 42.5 /100 | #179 | Average 84.6% |
| Immigrants | Netherlands | 42.1 /100 | #180 | Average 84.6% |
| Moroccans | 40.3 /100 | #181 | Average 84.6% |