Immigrants from Hong Kong vs Salvadoran In Labor Force | Age 30-34
COMPARE
Immigrants from Hong Kong
Salvadoran
In Labor Force | Age 30-34
In Labor Force | Age 30-34 Comparison
Immigrants from Hong Kong
Salvadorans
85.8%
IN LABOR FORCE | AGE 30-34
100.0/ 100
METRIC RATING
30th/ 347
METRIC RANK
84.2%
IN LABOR FORCE | AGE 30-34
3.8/ 100
METRIC RATING
221st/ 347
METRIC RANK
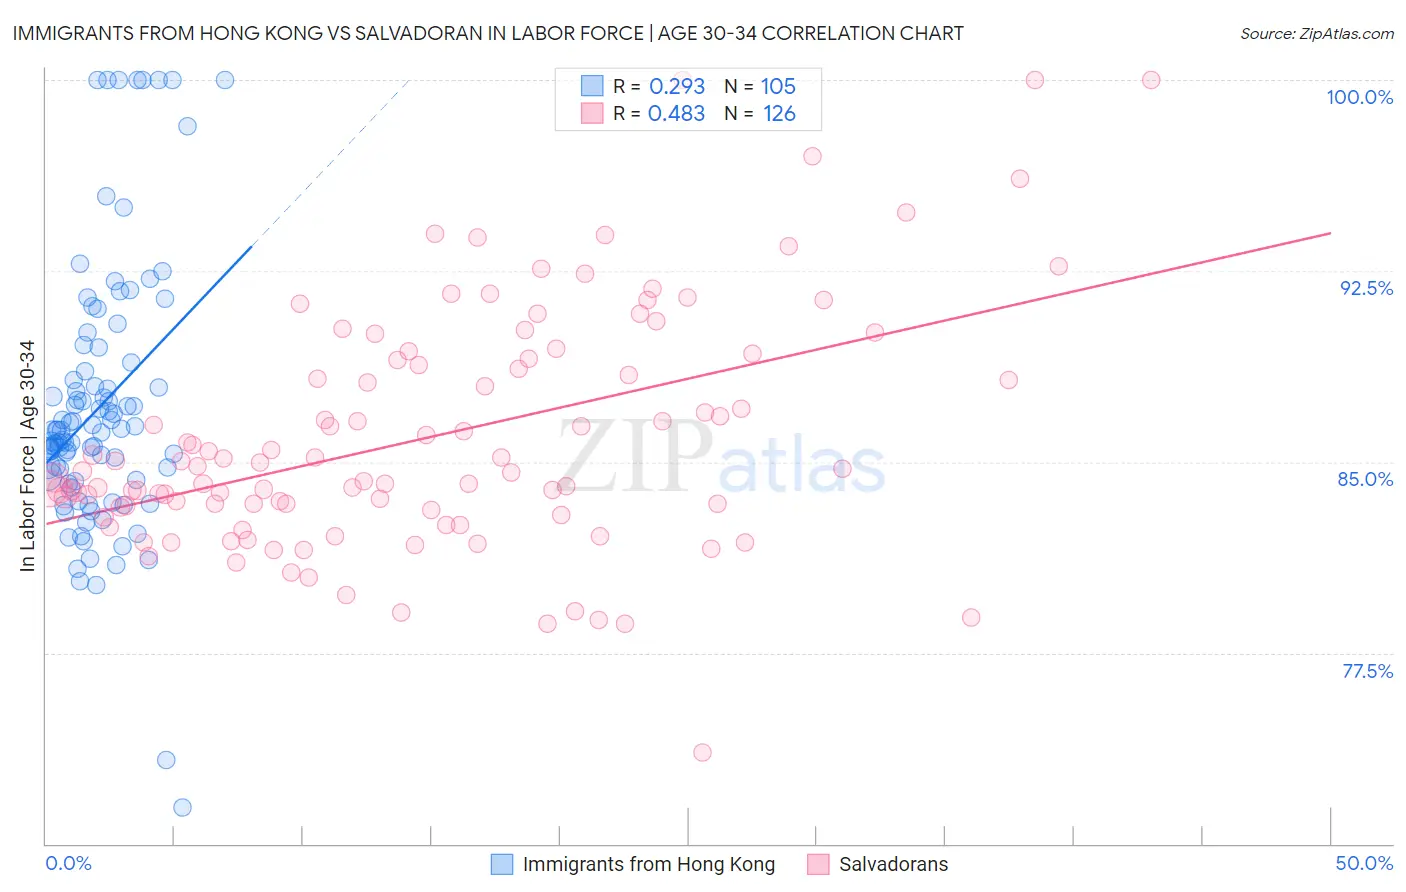
Immigrants from Hong Kong vs Salvadoran In Labor Force | Age 30-34 Correlation Chart
The statistical analysis conducted on geographies consisting of 253,906,280 people shows a weak positive correlation between the proportion of Immigrants from Hong Kong and labor force participation rate among population between the ages 30 and 34 in the United States with a correlation coefficient (R) of 0.293 and weighted average of 85.8%. Similarly, the statistical analysis conducted on geographies consisting of 398,763,176 people shows a moderate positive correlation between the proportion of Salvadorans and labor force participation rate among population between the ages 30 and 34 in the United States with a correlation coefficient (R) of 0.483 and weighted average of 84.2%, a difference of 1.9%.
In Labor Force | Age 30-34 Correlation Summary
| Measurement | Immigrants from Hong Kong | Salvadoran |
| Minimum | 71.4% | 73.6% |
| Maximum | 100.0% | 100.0% |
| Range | 28.6% | 26.4% |
| Mean | 87.2% | 86.0% |
| Median | 86.2% | 84.7% |
| Interquartile 25% (IQ1) | 84.3% | 83.2% |
| Interquartile 75% (IQ3) | 88.7% | 89.0% |
| Interquartile Range (IQR) | 4.5% | 5.8% |
| Standard Deviation (Sample) | 5.3% | 4.7% |
| Standard Deviation (Population) | 5.3% | 4.7% |
Similar Demographics by In Labor Force | Age 30-34
Demographics Similar to Immigrants from Hong Kong by In Labor Force | Age 30-34
In terms of in labor force | age 30-34, the demographic groups most similar to Immigrants from Hong Kong are Paraguayan (85.8%, a difference of 0.020%), Cypriot (85.8%, a difference of 0.020%), Tsimshian (85.8%, a difference of 0.040%), Immigrants from Latvia (85.9%, a difference of 0.060%), and Immigrants from Bosnia and Herzegovina (85.8%, a difference of 0.060%).
| Demographics | Rating | Rank | In Labor Force | Age 30-34 |
| Estonians | 100.0 /100 | #23 | Exceptional 85.9% |
| Immigrants | Eritrea | 100.0 /100 | #24 | Exceptional 85.9% |
| Immigrants | North Macedonia | 100.0 /100 | #25 | Exceptional 85.9% |
| Immigrants | Eastern Africa | 100.0 /100 | #26 | Exceptional 85.9% |
| Immigrants | Liberia | 100.0 /100 | #27 | Exceptional 85.9% |
| Immigrants | Latvia | 100.0 /100 | #28 | Exceptional 85.9% |
| Tsimshian | 100.0 /100 | #29 | Exceptional 85.8% |
| Immigrants | Hong Kong | 100.0 /100 | #30 | Exceptional 85.8% |
| Paraguayans | 99.9 /100 | #31 | Exceptional 85.8% |
| Cypriots | 99.9 /100 | #32 | Exceptional 85.8% |
| Immigrants | Bosnia and Herzegovina | 99.9 /100 | #33 | Exceptional 85.8% |
| Ugandans | 99.9 /100 | #34 | Exceptional 85.8% |
| Serbians | 99.9 /100 | #35 | Exceptional 85.8% |
| Albanians | 99.9 /100 | #36 | Exceptional 85.7% |
| Norwegians | 99.9 /100 | #37 | Exceptional 85.7% |
Demographics Similar to Salvadorans by In Labor Force | Age 30-34
In terms of in labor force | age 30-34, the demographic groups most similar to Salvadorans are Panamanian (84.2%, a difference of 0.0%), Immigrants from Laos (84.2%, a difference of 0.010%), Cuban (84.2%, a difference of 0.020%), Scottish (84.2%, a difference of 0.040%), and Immigrants from El Salvador (84.2%, a difference of 0.040%).
| Demographics | Rating | Rank | In Labor Force | Age 30-34 |
| Immigrants | Germany | 7.2 /100 | #214 | Tragic 84.3% |
| Europeans | 7.2 /100 | #215 | Tragic 84.3% |
| Immigrants | Ecuador | 7.1 /100 | #216 | Tragic 84.3% |
| Immigrants | Trinidad and Tobago | 7.0 /100 | #217 | Tragic 84.3% |
| Immigrants | Panama | 6.3 /100 | #218 | Tragic 84.3% |
| Swiss | 5.8 /100 | #219 | Tragic 84.3% |
| Danes | 5.3 /100 | #220 | Tragic 84.3% |
| Salvadorans | 3.8 /100 | #221 | Tragic 84.2% |
| Panamanians | 3.8 /100 | #222 | Tragic 84.2% |
| Immigrants | Laos | 3.6 /100 | #223 | Tragic 84.2% |
| Cubans | 3.4 /100 | #224 | Tragic 84.2% |
| Scottish | 3.1 /100 | #225 | Tragic 84.2% |
| Immigrants | El Salvador | 3.0 /100 | #226 | Tragic 84.2% |
| Immigrants | Cuba | 3.0 /100 | #227 | Tragic 84.2% |
| Immigrants | Haiti | 2.8 /100 | #228 | Tragic 84.2% |