Okinawan vs Immigrants from Somalia In Labor Force | Age 45-54
COMPARE
Okinawan
Immigrants from Somalia
In Labor Force | Age 45-54
In Labor Force | Age 45-54 Comparison
Okinawans
Immigrants from Somalia
83.0%
IN LABOR FORCE | AGE 45-54
77.0/ 100
METRIC RATING
143rd/ 347
METRIC RANK
83.4%
IN LABOR FORCE | AGE 45-54
96.9/ 100
METRIC RATING
74th/ 347
METRIC RANK
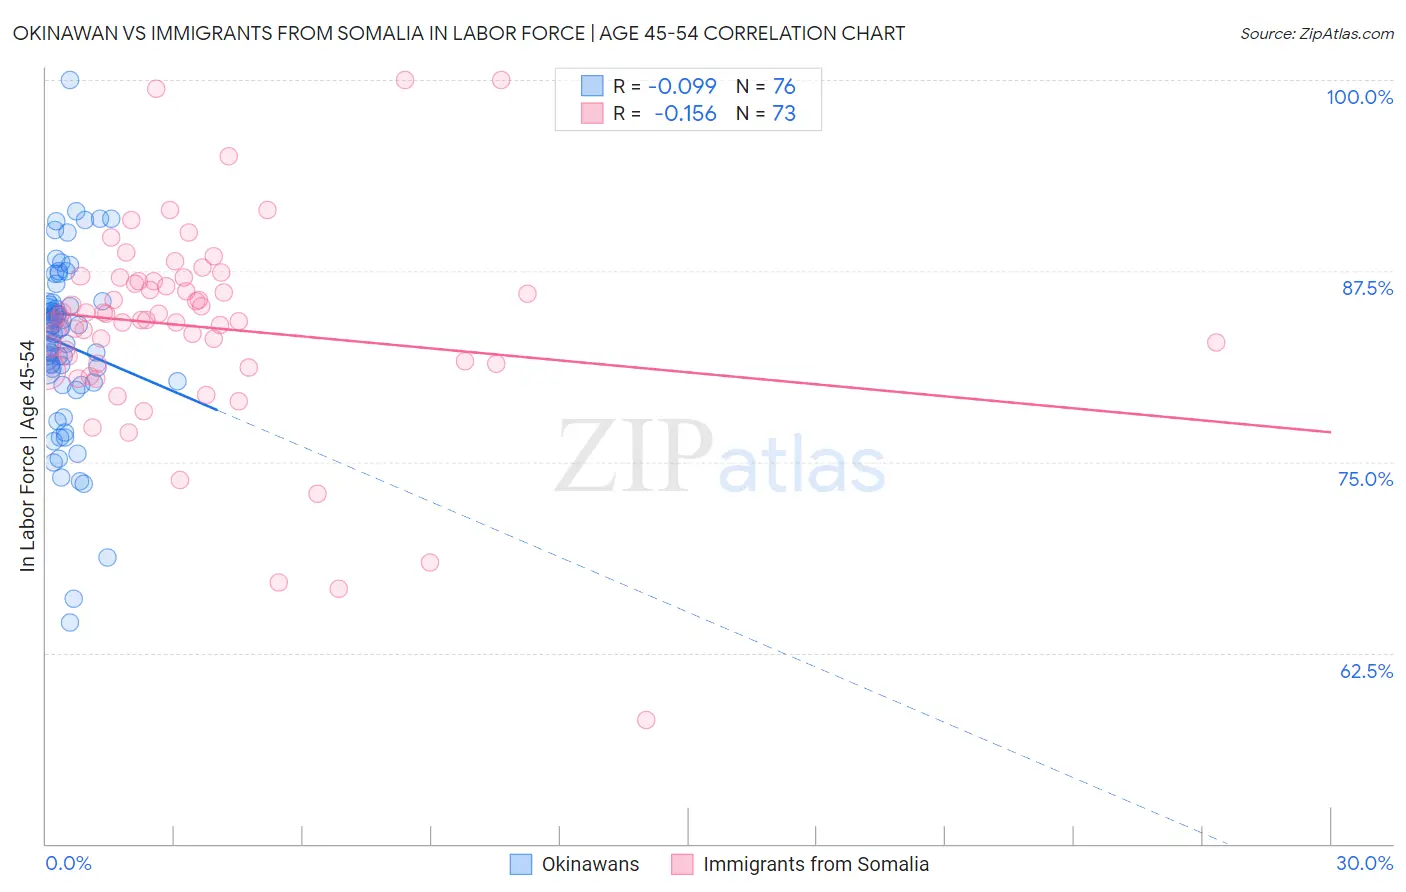
Okinawan vs Immigrants from Somalia In Labor Force | Age 45-54 Correlation Chart
The statistical analysis conducted on geographies consisting of 73,729,827 people shows a slight negative correlation between the proportion of Okinawans and labor force participation rate among population between the ages 45 and 54 in the United States with a correlation coefficient (R) of -0.099 and weighted average of 83.0%. Similarly, the statistical analysis conducted on geographies consisting of 92,094,629 people shows a poor negative correlation between the proportion of Immigrants from Somalia and labor force participation rate among population between the ages 45 and 54 in the United States with a correlation coefficient (R) of -0.156 and weighted average of 83.4%, a difference of 0.49%.
In Labor Force | Age 45-54 Correlation Summary
| Measurement | Okinawan | Immigrants from Somalia |
| Minimum | 64.5% | 58.1% |
| Maximum | 100.0% | 100.0% |
| Range | 35.5% | 41.9% |
| Mean | 82.7% | 83.9% |
| Median | 83.6% | 84.3% |
| Interquartile 25% (IQ1) | 80.2% | 81.4% |
| Interquartile 75% (IQ3) | 85.3% | 86.8% |
| Interquartile Range (IQR) | 5.1% | 5.4% |
| Standard Deviation (Sample) | 5.8% | 6.7% |
| Standard Deviation (Population) | 5.7% | 6.7% |
Similar Demographics by In Labor Force | Age 45-54
Demographics Similar to Okinawans by In Labor Force | Age 45-54
In terms of in labor force | age 45-54, the demographic groups most similar to Okinawans are Soviet Union (83.0%, a difference of 0.0%), Immigrants from Haiti (83.0%, a difference of 0.010%), Immigrants from Scotland (83.0%, a difference of 0.010%), Scandinavian (83.0%, a difference of 0.020%), and Yugoslavian (83.0%, a difference of 0.020%).
| Demographics | Rating | Rank | In Labor Force | Age 45-54 |
| Immigrants | Kazakhstan | 81.0 /100 | #136 | Excellent 83.0% |
| Immigrants | Spain | 80.4 /100 | #137 | Excellent 83.0% |
| Ghanaians | 79.5 /100 | #138 | Good 83.0% |
| Scandinavians | 78.5 /100 | #139 | Good 83.0% |
| Yugoslavians | 78.3 /100 | #140 | Good 83.0% |
| Immigrants | Haiti | 77.9 /100 | #141 | Good 83.0% |
| Immigrants | Scotland | 77.8 /100 | #142 | Good 83.0% |
| Okinawans | 77.0 /100 | #143 | Good 83.0% |
| Soviet Union | 76.8 /100 | #144 | Good 83.0% |
| Romanians | 75.4 /100 | #145 | Good 83.0% |
| Immigrants | France | 75.3 /100 | #146 | Good 83.0% |
| Czechoslovakians | 74.8 /100 | #147 | Good 83.0% |
| Immigrants | Nigeria | 74.1 /100 | #148 | Good 83.0% |
| Immigrants | Sweden | 73.3 /100 | #149 | Good 82.9% |
| Immigrants | Netherlands | 72.6 /100 | #150 | Good 82.9% |
Demographics Similar to Immigrants from Somalia by In Labor Force | Age 45-54
In terms of in labor force | age 45-54, the demographic groups most similar to Immigrants from Somalia are Estonian (83.4%, a difference of 0.0%), Russian (83.4%, a difference of 0.0%), Immigrants from Czechoslovakia (83.4%, a difference of 0.010%), Cuban (83.4%, a difference of 0.010%), and Serbian (83.4%, a difference of 0.020%).
| Demographics | Rating | Rank | In Labor Force | Age 45-54 |
| Chileans | 97.7 /100 | #67 | Exceptional 83.4% |
| Immigrants | Colombia | 97.6 /100 | #68 | Exceptional 83.4% |
| Taiwanese | 97.5 /100 | #69 | Exceptional 83.4% |
| Immigrants | Latvia | 97.4 /100 | #70 | Exceptional 83.4% |
| Colombians | 97.3 /100 | #71 | Exceptional 83.4% |
| Serbians | 97.2 /100 | #72 | Exceptional 83.4% |
| Immigrants | Czechoslovakia | 97.1 /100 | #73 | Exceptional 83.4% |
| Immigrants | Somalia | 96.9 /100 | #74 | Exceptional 83.4% |
| Estonians | 96.9 /100 | #75 | Exceptional 83.4% |
| Russians | 96.8 /100 | #76 | Exceptional 83.4% |
| Cubans | 96.7 /100 | #77 | Exceptional 83.4% |
| Immigrants | Egypt | 96.6 /100 | #78 | Exceptional 83.4% |
| Belgians | 96.5 /100 | #79 | Exceptional 83.4% |
| Immigrants | Croatia | 96.5 /100 | #80 | Exceptional 83.4% |
| Jordanians | 96.4 /100 | #81 | Exceptional 83.4% |