Latvian vs Immigrants from Zaire In Labor Force | Age 45-54
COMPARE
Latvian
Immigrants from Zaire
In Labor Force | Age 45-54
In Labor Force | Age 45-54 Comparison
Latvians
Immigrants from Zaire
83.8%
IN LABOR FORCE | AGE 45-54
99.7/ 100
METRIC RATING
33rd/ 347
METRIC RANK
82.8%
IN LABOR FORCE | AGE 45-54
52.9/ 100
METRIC RATING
171st/ 347
METRIC RANK
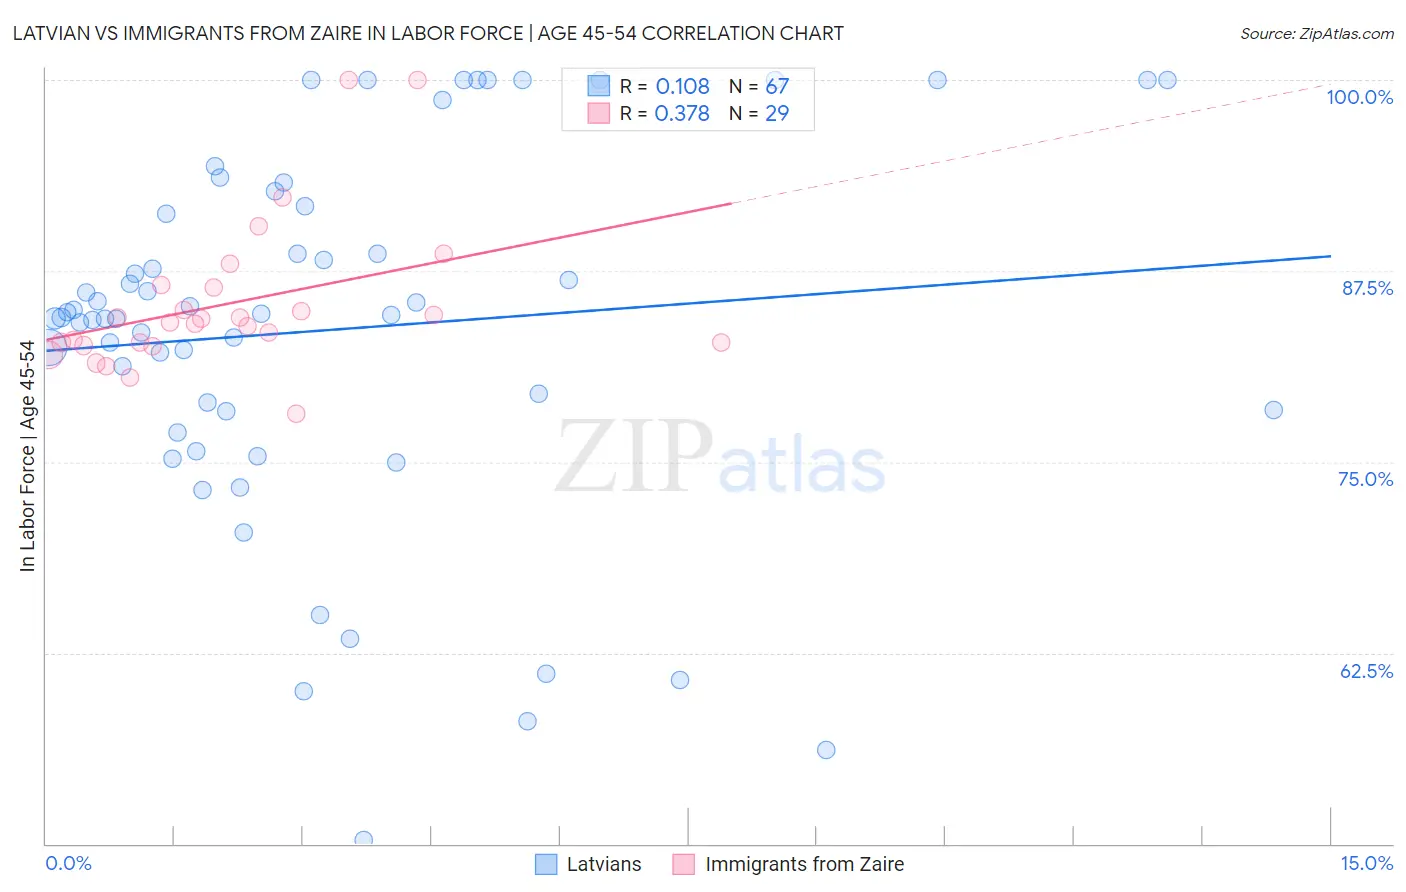
Latvian vs Immigrants from Zaire In Labor Force | Age 45-54 Correlation Chart
The statistical analysis conducted on geographies consisting of 220,643,434 people shows a poor positive correlation between the proportion of Latvians and labor force participation rate among population between the ages 45 and 54 in the United States with a correlation coefficient (R) of 0.108 and weighted average of 83.8%. Similarly, the statistical analysis conducted on geographies consisting of 107,243,471 people shows a mild positive correlation between the proportion of Immigrants from Zaire and labor force participation rate among population between the ages 45 and 54 in the United States with a correlation coefficient (R) of 0.378 and weighted average of 82.8%, a difference of 1.2%.
In Labor Force | Age 45-54 Correlation Summary
| Measurement | Latvian | Immigrants from Zaire |
| Minimum | 50.2% | 78.2% |
| Maximum | 100.0% | 100.0% |
| Range | 49.8% | 21.8% |
| Mean | 83.7% | 85.4% |
| Median | 84.6% | 84.1% |
| Interquartile 25% (IQ1) | 78.3% | 82.7% |
| Interquartile 75% (IQ3) | 91.7% | 86.5% |
| Interquartile Range (IQR) | 13.4% | 3.8% |
| Standard Deviation (Sample) | 12.0% | 5.0% |
| Standard Deviation (Population) | 11.9% | 4.9% |
Similar Demographics by In Labor Force | Age 45-54
Demographics Similar to Latvians by In Labor Force | Age 45-54
In terms of in labor force | age 45-54, the demographic groups most similar to Latvians are Turkish (83.8%, a difference of 0.010%), Immigrants from Eritrea (83.8%, a difference of 0.020%), Immigrants from Bulgaria (83.8%, a difference of 0.040%), Immigrants from Pakistan (83.8%, a difference of 0.070%), and Immigrants from Lithuania (83.9%, a difference of 0.090%).
| Demographics | Rating | Rank | In Labor Force | Age 45-54 |
| Immigrants | Serbia | 99.8 /100 | #26 | Exceptional 83.9% |
| Immigrants | Brazil | 99.8 /100 | #27 | Exceptional 83.9% |
| Immigrants | Lithuania | 99.8 /100 | #28 | Exceptional 83.9% |
| Immigrants | Pakistan | 99.7 /100 | #29 | Exceptional 83.8% |
| Immigrants | Bulgaria | 99.7 /100 | #30 | Exceptional 83.8% |
| Immigrants | Eritrea | 99.7 /100 | #31 | Exceptional 83.8% |
| Turks | 99.7 /100 | #32 | Exceptional 83.8% |
| Latvians | 99.7 /100 | #33 | Exceptional 83.8% |
| Kenyans | 99.5 /100 | #34 | Exceptional 83.7% |
| Brazilians | 99.5 /100 | #35 | Exceptional 83.7% |
| Ugandans | 99.5 /100 | #36 | Exceptional 83.7% |
| Swedes | 99.4 /100 | #37 | Exceptional 83.7% |
| Immigrants | Venezuela | 99.4 /100 | #38 | Exceptional 83.7% |
| Immigrants | Cuba | 99.4 /100 | #39 | Exceptional 83.7% |
| Immigrants | Uganda | 99.4 /100 | #40 | Exceptional 83.7% |
Demographics Similar to Immigrants from Zaire by In Labor Force | Age 45-54
In terms of in labor force | age 45-54, the demographic groups most similar to Immigrants from Zaire are Pakistani (82.8%, a difference of 0.0%), Immigrants from Western Africa (82.8%, a difference of 0.010%), Icelander (82.8%, a difference of 0.010%), Nicaraguan (82.8%, a difference of 0.020%), and Swiss (82.8%, a difference of 0.030%).
| Demographics | Rating | Rank | In Labor Force | Age 45-54 |
| German Russians | 61.3 /100 | #164 | Good 82.8% |
| Immigrants | Sudan | 59.9 /100 | #165 | Average 82.8% |
| Immigrants | South Eastern Asia | 57.4 /100 | #166 | Average 82.8% |
| Swiss | 56.5 /100 | #167 | Average 82.8% |
| Immigrants | South Africa | 55.8 /100 | #168 | Average 82.8% |
| Immigrants | Western Africa | 54.1 /100 | #169 | Average 82.8% |
| Pakistanis | 53.2 /100 | #170 | Average 82.8% |
| Immigrants | Zaire | 52.9 /100 | #171 | Average 82.8% |
| Icelanders | 51.8 /100 | #172 | Average 82.8% |
| Nicaraguans | 50.3 /100 | #173 | Average 82.8% |
| Costa Ricans | 50.0 /100 | #174 | Average 82.8% |
| Immigrants | Liberia | 47.9 /100 | #175 | Average 82.7% |
| Northern Europeans | 46.9 /100 | #176 | Average 82.7% |
| Immigrants | Nicaragua | 44.6 /100 | #177 | Average 82.7% |
| Nigerians | 40.5 /100 | #178 | Average 82.7% |