Native/Alaskan vs Finnish In Labor Force | Age 35-44
COMPARE
Native/Alaskan
Finnish
In Labor Force | Age 35-44
In Labor Force | Age 35-44 Comparison
Natives/Alaskans
Finns
78.9%
IN LABOR FORCE | AGE 35-44
0.0/ 100
METRIC RATING
335th/ 347
METRIC RANK
84.7%
IN LABOR FORCE | AGE 35-44
91.2/ 100
METRIC RATING
121st/ 347
METRIC RANK
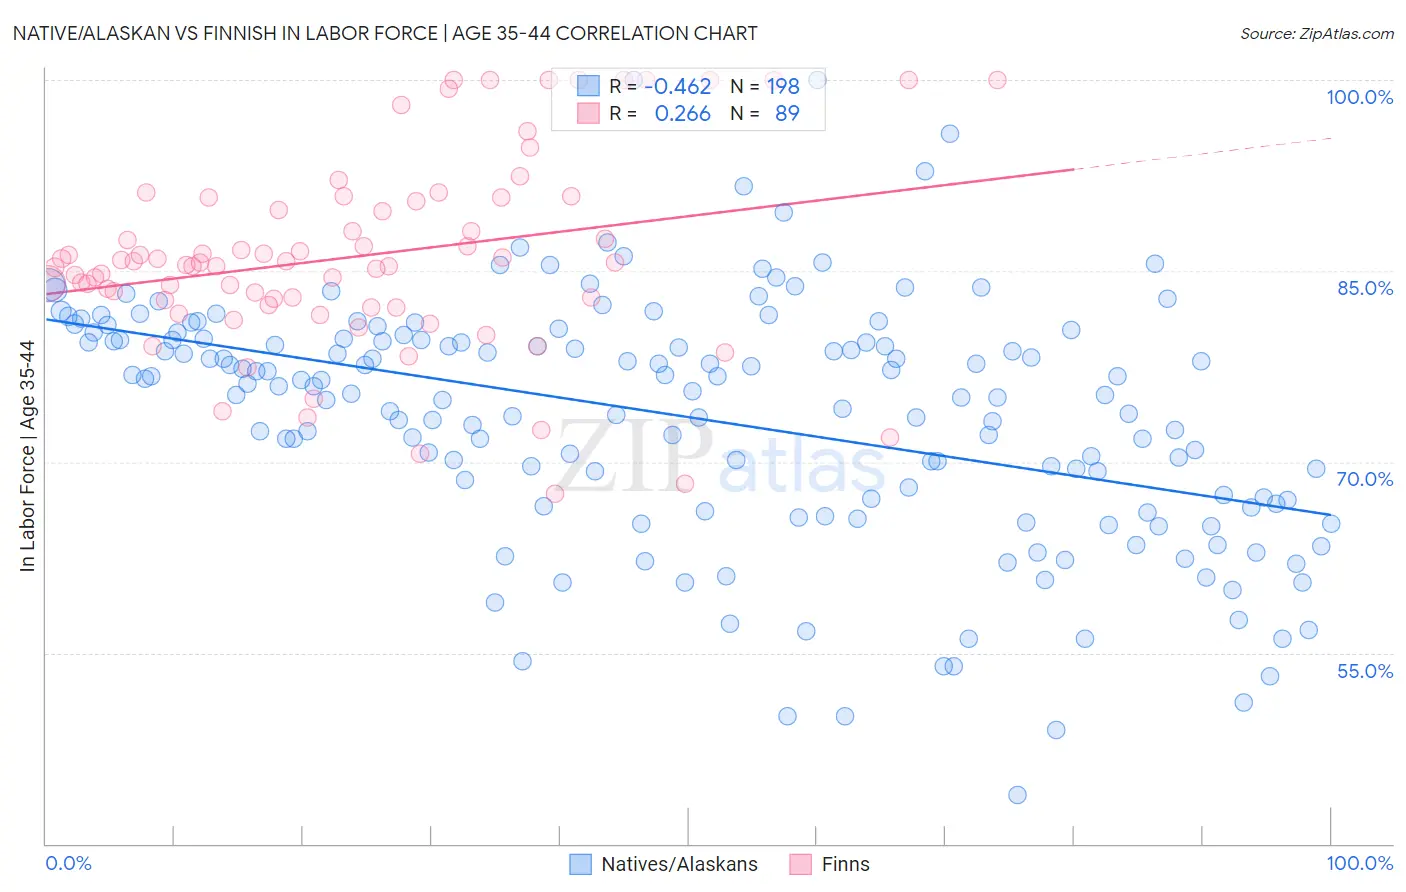
Native/Alaskan vs Finnish In Labor Force | Age 35-44 Correlation Chart
The statistical analysis conducted on geographies consisting of 512,690,286 people shows a moderate negative correlation between the proportion of Natives/Alaskans and labor force participation rate among population between the ages 35 and 44 in the United States with a correlation coefficient (R) of -0.462 and weighted average of 78.9%. Similarly, the statistical analysis conducted on geographies consisting of 404,525,651 people shows a weak positive correlation between the proportion of Finns and labor force participation rate among population between the ages 35 and 44 in the United States with a correlation coefficient (R) of 0.266 and weighted average of 84.7%, a difference of 7.4%.
In Labor Force | Age 35-44 Correlation Summary
| Measurement | Native/Alaskan | Finnish |
| Minimum | 43.8% | 67.5% |
| Maximum | 100.0% | 100.0% |
| Range | 56.2% | 32.5% |
| Mean | 73.5% | 86.2% |
| Median | 75.7% | 85.6% |
| Interquartile 25% (IQ1) | 67.0% | 82.5% |
| Interquartile 75% (IQ3) | 79.7% | 90.6% |
| Interquartile Range (IQR) | 12.7% | 8.1% |
| Standard Deviation (Sample) | 9.6% | 7.5% |
| Standard Deviation (Population) | 9.6% | 7.5% |
Similar Demographics by In Labor Force | Age 35-44
Demographics Similar to Natives/Alaskans by In Labor Force | Age 35-44
In terms of in labor force | age 35-44, the demographic groups most similar to Natives/Alaskans are Yakama (79.0%, a difference of 0.11%), Kiowa (79.2%, a difference of 0.40%), Ute (79.4%, a difference of 0.73%), Houma (79.5%, a difference of 0.79%), and Cheyenne (79.5%, a difference of 0.81%).
| Demographics | Rating | Rank | In Labor Force | Age 35-44 |
| Creek | 0.0 /100 | #328 | Tragic 80.0% |
| Menominee | 0.0 /100 | #329 | Tragic 79.7% |
| Cheyenne | 0.0 /100 | #330 | Tragic 79.5% |
| Houma | 0.0 /100 | #331 | Tragic 79.5% |
| Ute | 0.0 /100 | #332 | Tragic 79.4% |
| Kiowa | 0.0 /100 | #333 | Tragic 79.2% |
| Yakama | 0.0 /100 | #334 | Tragic 79.0% |
| Natives/Alaskans | 0.0 /100 | #335 | Tragic 78.9% |
| Arapaho | 0.0 /100 | #336 | Tragic 78.1% |
| Apache | 0.0 /100 | #337 | Tragic 77.9% |
| Pueblo | 0.0 /100 | #338 | Tragic 77.4% |
| Yup'ik | 0.0 /100 | #339 | Tragic 77.3% |
| Lumbee | 0.0 /100 | #340 | Tragic 77.0% |
| Hopi | 0.0 /100 | #341 | Tragic 77.0% |
| Crow | 0.0 /100 | #342 | Tragic 76.5% |
Demographics Similar to Finns by In Labor Force | Age 35-44
In terms of in labor force | age 35-44, the demographic groups most similar to Finns are German (84.7%, a difference of 0.0%), Immigrants from South America (84.7%, a difference of 0.0%), Burmese (84.7%, a difference of 0.010%), Immigrants from Northern Europe (84.7%, a difference of 0.010%), and Slavic (84.7%, a difference of 0.010%).
| Demographics | Rating | Rank | In Labor Force | Age 35-44 |
| Chileans | 93.2 /100 | #114 | Exceptional 84.7% |
| Bahamians | 93.2 /100 | #115 | Exceptional 84.7% |
| Immigrants | Egypt | 92.7 /100 | #116 | Exceptional 84.7% |
| Immigrants | China | 92.3 /100 | #117 | Exceptional 84.7% |
| Immigrants | Eastern Asia | 92.1 /100 | #118 | Exceptional 84.7% |
| Burmese | 91.8 /100 | #119 | Exceptional 84.7% |
| Immigrants | Northern Europe | 91.5 /100 | #120 | Exceptional 84.7% |
| Finns | 91.2 /100 | #121 | Exceptional 84.7% |
| Germans | 91.0 /100 | #122 | Exceptional 84.7% |
| Immigrants | South America | 90.9 /100 | #123 | Exceptional 84.7% |
| Slavs | 90.8 /100 | #124 | Exceptional 84.7% |
| Maltese | 90.8 /100 | #125 | Exceptional 84.7% |
| Asians | 90.6 /100 | #126 | Exceptional 84.7% |
| Immigrants | Spain | 90.6 /100 | #127 | Exceptional 84.7% |
| Immigrants | Ghana | 90.4 /100 | #128 | Exceptional 84.7% |