Bolivian vs U.S. Virgin Islander In Labor Force | Age 25-29
COMPARE
Bolivian
U.S. Virgin Islander
In Labor Force | Age 25-29
In Labor Force | Age 25-29 Comparison
Bolivians
U.S. Virgin Islanders
86.1%
IN LABOR FORCE | AGE 25-29
100.0/ 100
METRIC RATING
15th/ 347
METRIC RANK
83.8%
IN LABOR FORCE | AGE 25-29
0.6/ 100
METRIC RATING
242nd/ 347
METRIC RANK
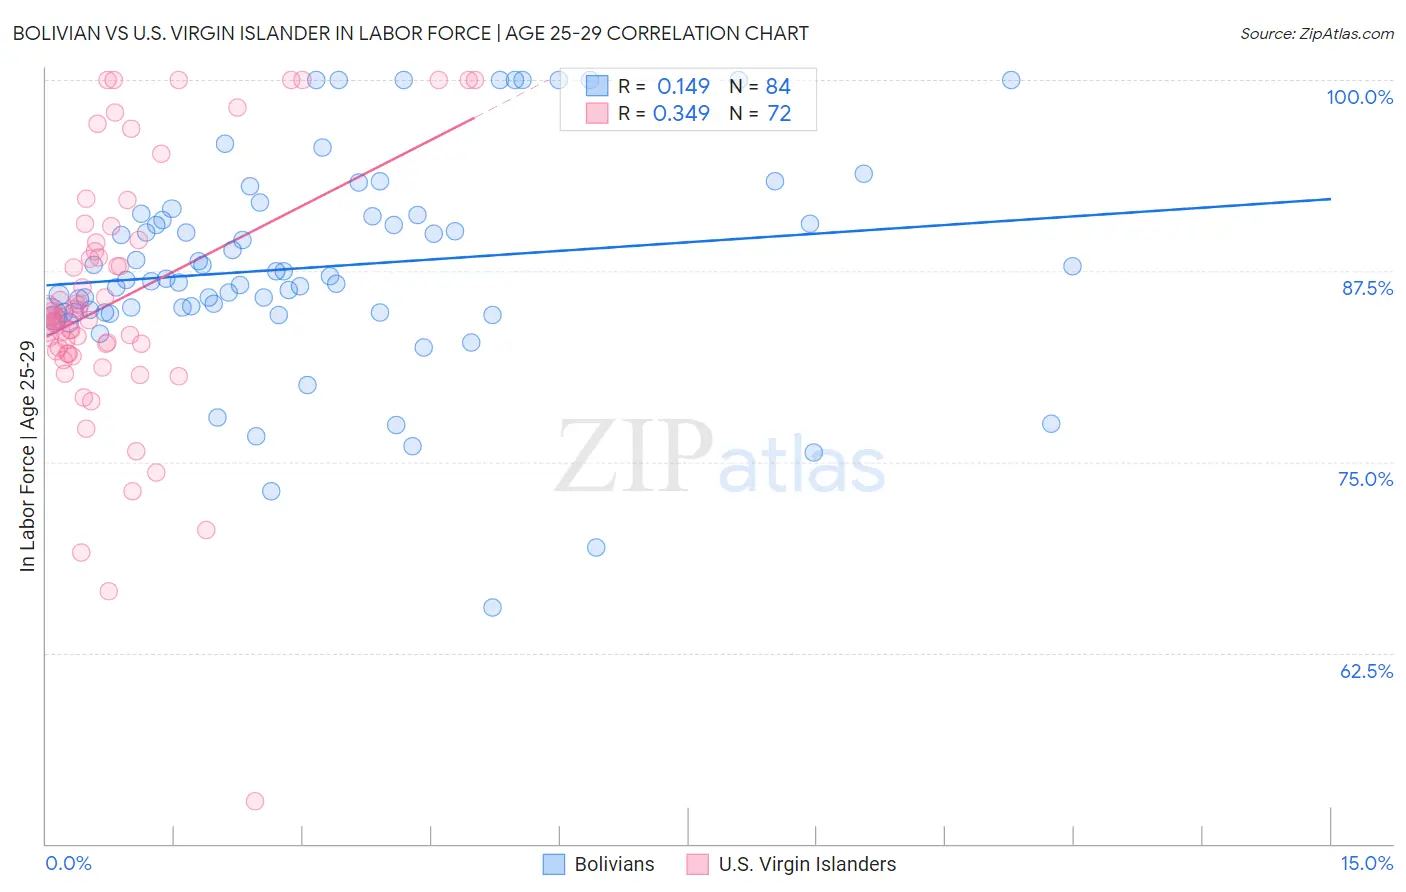
Bolivian vs U.S. Virgin Islander In Labor Force | Age 25-29 Correlation Chart
The statistical analysis conducted on geographies consisting of 184,657,655 people shows a poor positive correlation between the proportion of Bolivians and labor force participation rate among population between the ages 25 and 29 in the United States with a correlation coefficient (R) of 0.149 and weighted average of 86.1%. Similarly, the statistical analysis conducted on geographies consisting of 87,522,048 people shows a mild positive correlation between the proportion of U.S. Virgin Islanders and labor force participation rate among population between the ages 25 and 29 in the United States with a correlation coefficient (R) of 0.349 and weighted average of 83.8%, a difference of 2.7%.
In Labor Force | Age 25-29 Correlation Summary
| Measurement | Bolivian | U.S. Virgin Islander |
| Minimum | 65.5% | 52.8% |
| Maximum | 100.0% | 100.0% |
| Range | 34.5% | 47.2% |
| Mean | 87.8% | 85.6% |
| Median | 86.9% | 84.5% |
| Interquartile 25% (IQ1) | 84.8% | 82.2% |
| Interquartile 75% (IQ3) | 91.1% | 89.4% |
| Interquartile Range (IQR) | 6.3% | 7.3% |
| Standard Deviation (Sample) | 6.9% | 8.6% |
| Standard Deviation (Population) | 6.9% | 8.5% |
Similar Demographics by In Labor Force | Age 25-29
Demographics Similar to Bolivians by In Labor Force | Age 25-29
In terms of in labor force | age 25-29, the demographic groups most similar to Bolivians are Latvian (86.1%, a difference of 0.0%), Immigrants from Bolivia (86.1%, a difference of 0.010%), Norwegian (86.1%, a difference of 0.030%), Immigrants from Lithuania (86.1%, a difference of 0.040%), and Immigrants from Ethiopia (86.1%, a difference of 0.050%).
| Demographics | Rating | Rank | In Labor Force | Age 25-29 |
| Immigrants | Cabo Verde | 100.0 /100 | #8 | Exceptional 86.2% |
| Ethiopians | 100.0 /100 | #9 | Exceptional 86.2% |
| Liberians | 100.0 /100 | #10 | Exceptional 86.1% |
| Immigrants | Ethiopia | 100.0 /100 | #11 | Exceptional 86.1% |
| Immigrants | Lithuania | 100.0 /100 | #12 | Exceptional 86.1% |
| Norwegians | 100.0 /100 | #13 | Exceptional 86.1% |
| Latvians | 100.0 /100 | #14 | Exceptional 86.1% |
| Bolivians | 100.0 /100 | #15 | Exceptional 86.1% |
| Immigrants | Bolivia | 100.0 /100 | #16 | Exceptional 86.1% |
| Bermudans | 100.0 /100 | #17 | Exceptional 86.0% |
| Bulgarians | 100.0 /100 | #18 | Exceptional 86.0% |
| Cape Verdeans | 100.0 /100 | #19 | Exceptional 86.0% |
| Immigrants | Ireland | 100.0 /100 | #20 | Exceptional 86.0% |
| Maltese | 100.0 /100 | #21 | Exceptional 86.0% |
| Cambodians | 100.0 /100 | #22 | Exceptional 86.0% |
Demographics Similar to U.S. Virgin Islanders by In Labor Force | Age 25-29
In terms of in labor force | age 25-29, the demographic groups most similar to U.S. Virgin Islanders are Salvadoran (83.8%, a difference of 0.010%), Alsatian (83.9%, a difference of 0.030%), Immigrants from Jamaica (83.8%, a difference of 0.050%), Iroquois (83.8%, a difference of 0.050%), and Immigrants from Uzbekistan (83.9%, a difference of 0.060%).
| Demographics | Rating | Rank | In Labor Force | Age 25-29 |
| Iraqis | 0.9 /100 | #235 | Tragic 83.9% |
| Guamanians/Chamorros | 0.9 /100 | #236 | Tragic 83.9% |
| Immigrants | Immigrants | 0.9 /100 | #237 | Tragic 83.9% |
| Immigrants | Uzbekistan | 0.8 /100 | #238 | Tragic 83.9% |
| Jamaicans | 0.8 /100 | #239 | Tragic 83.9% |
| Trinidadians and Tobagonians | 0.7 /100 | #240 | Tragic 83.9% |
| Alsatians | 0.7 /100 | #241 | Tragic 83.9% |
| U.S. Virgin Islanders | 0.6 /100 | #242 | Tragic 83.8% |
| Salvadorans | 0.5 /100 | #243 | Tragic 83.8% |
| Immigrants | Jamaica | 0.4 /100 | #244 | Tragic 83.8% |
| Iroquois | 0.4 /100 | #245 | Tragic 83.8% |
| Cree | 0.3 /100 | #246 | Tragic 83.8% |
| Immigrants | El Salvador | 0.3 /100 | #247 | Tragic 83.7% |
| Immigrants | Nonimmigrants | 0.3 /100 | #248 | Tragic 83.7% |
| Hmong | 0.3 /100 | #249 | Tragic 83.7% |