Immigrants from Micronesia vs Vietnamese In Labor Force | Age 16-19
COMPARE
Immigrants from Micronesia
Vietnamese
In Labor Force | Age 16-19
In Labor Force | Age 16-19 Comparison
Immigrants from Micronesia
Vietnamese
40.2%
IN LABOR FORCE | AGE 16-19
100.0/ 100
METRIC RATING
64th/ 347
METRIC RANK
29.6%
IN LABOR FORCE | AGE 16-19
0.0/ 100
METRIC RATING
338th/ 347
METRIC RANK
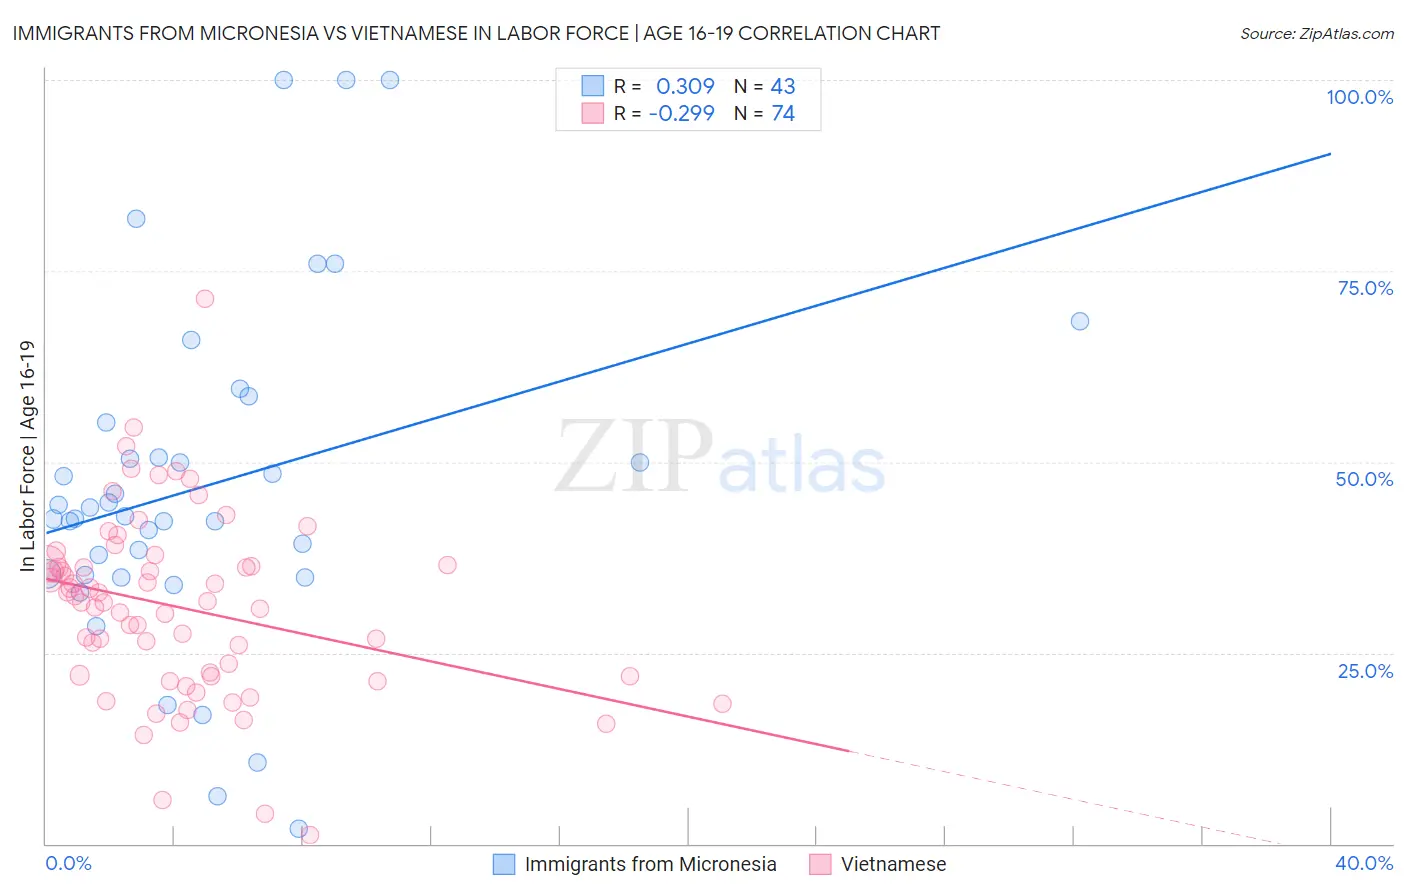
Immigrants from Micronesia vs Vietnamese In Labor Force | Age 16-19 Correlation Chart
The statistical analysis conducted on geographies consisting of 61,545,841 people shows a mild positive correlation between the proportion of Immigrants from Micronesia and labor force participation rate among population between the ages 16 and 19 in the United States with a correlation coefficient (R) of 0.309 and weighted average of 40.2%. Similarly, the statistical analysis conducted on geographies consisting of 170,670,712 people shows a weak negative correlation between the proportion of Vietnamese and labor force participation rate among population between the ages 16 and 19 in the United States with a correlation coefficient (R) of -0.299 and weighted average of 29.6%, a difference of 35.9%.
In Labor Force | Age 16-19 Correlation Summary
| Measurement | Immigrants from Micronesia | Vietnamese |
| Minimum | 1.9% | 1.1% |
| Maximum | 100.0% | 71.4% |
| Range | 98.1% | 70.3% |
| Mean | 46.9% | 30.9% |
| Median | 42.9% | 31.6% |
| Interquartile 25% (IQ1) | 35.2% | 22.0% |
| Interquartile 75% (IQ3) | 55.2% | 36.5% |
| Interquartile Range (IQR) | 20.0% | 14.5% |
| Standard Deviation (Sample) | 22.3% | 12.0% |
| Standard Deviation (Population) | 22.1% | 11.9% |
Similar Demographics by In Labor Force | Age 16-19
Demographics Similar to Immigrants from Micronesia by In Labor Force | Age 16-19
In terms of in labor force | age 16-19, the demographic groups most similar to Immigrants from Micronesia are Kenyan (40.1%, a difference of 0.080%), Northern European (40.2%, a difference of 0.12%), Cherokee (40.2%, a difference of 0.17%), Nonimmigrants (40.1%, a difference of 0.20%), and Canadian (40.1%, a difference of 0.21%).
| Demographics | Rating | Rank | In Labor Force | Age 16-19 |
| Lithuanians | 100.0 /100 | #57 | Exceptional 40.4% |
| Aleuts | 100.0 /100 | #58 | Exceptional 40.4% |
| Slavs | 100.0 /100 | #59 | Exceptional 40.4% |
| Immigrants | Eastern Africa | 100.0 /100 | #60 | Exceptional 40.4% |
| Americans | 100.0 /100 | #61 | Exceptional 40.3% |
| Cherokee | 100.0 /100 | #62 | Exceptional 40.2% |
| Northern Europeans | 100.0 /100 | #63 | Exceptional 40.2% |
| Immigrants | Micronesia | 100.0 /100 | #64 | Exceptional 40.2% |
| Kenyans | 100.0 /100 | #65 | Exceptional 40.1% |
| Immigrants | Nonimmigrants | 100.0 /100 | #66 | Exceptional 40.1% |
| Canadians | 100.0 /100 | #67 | Exceptional 40.1% |
| Italians | 99.9 /100 | #68 | Exceptional 40.1% |
| Potawatomi | 99.9 /100 | #69 | Exceptional 40.0% |
| Portuguese | 99.9 /100 | #70 | Exceptional 40.0% |
| Serbians | 99.9 /100 | #71 | Exceptional 39.9% |
Demographics Similar to Vietnamese by In Labor Force | Age 16-19
In terms of in labor force | age 16-19, the demographic groups most similar to Vietnamese are Immigrants from Uzbekistan (29.2%, a difference of 1.4%), British West Indian (29.1%, a difference of 1.6%), Immigrants from Bangladesh (30.0%, a difference of 1.7%), Immigrants from Armenia (29.0%, a difference of 1.8%), and Immigrants from Barbados (29.0%, a difference of 2.0%).
| Demographics | Rating | Rank | In Labor Force | Age 16-19 |
| Trinidadians and Tobagonians | 0.0 /100 | #331 | Tragic 30.9% |
| Immigrants | Israel | 0.0 /100 | #332 | Tragic 30.5% |
| Immigrants | Hong Kong | 0.0 /100 | #333 | Tragic 30.5% |
| Puerto Ricans | 0.0 /100 | #334 | Tragic 30.3% |
| Immigrants | Cuba | 0.0 /100 | #335 | Tragic 30.2% |
| Immigrants | Trinidad and Tobago | 0.0 /100 | #336 | Tragic 30.2% |
| Immigrants | Bangladesh | 0.0 /100 | #337 | Tragic 30.0% |
| Vietnamese | 0.0 /100 | #338 | Tragic 29.6% |
| Immigrants | Uzbekistan | 0.0 /100 | #339 | Tragic 29.2% |
| British West Indians | 0.0 /100 | #340 | Tragic 29.1% |
| Immigrants | Armenia | 0.0 /100 | #341 | Tragic 29.0% |
| Immigrants | Barbados | 0.0 /100 | #342 | Tragic 29.0% |
| Yuman | 0.0 /100 | #343 | Tragic 27.7% |
| Guyanese | 0.0 /100 | #344 | Tragic 27.4% |
| Immigrants | Guyana | 0.0 /100 | #345 | Tragic 27.3% |