Immigrants from El Salvador vs Vietnamese In Labor Force | Age 16-19
COMPARE
Immigrants from El Salvador
Vietnamese
In Labor Force | Age 16-19
In Labor Force | Age 16-19 Comparison
Immigrants from El Salvador
Vietnamese
34.3%
IN LABOR FORCE | AGE 16-19
0.7/ 100
METRIC RATING
265th/ 347
METRIC RANK
29.6%
IN LABOR FORCE | AGE 16-19
0.0/ 100
METRIC RATING
338th/ 347
METRIC RANK
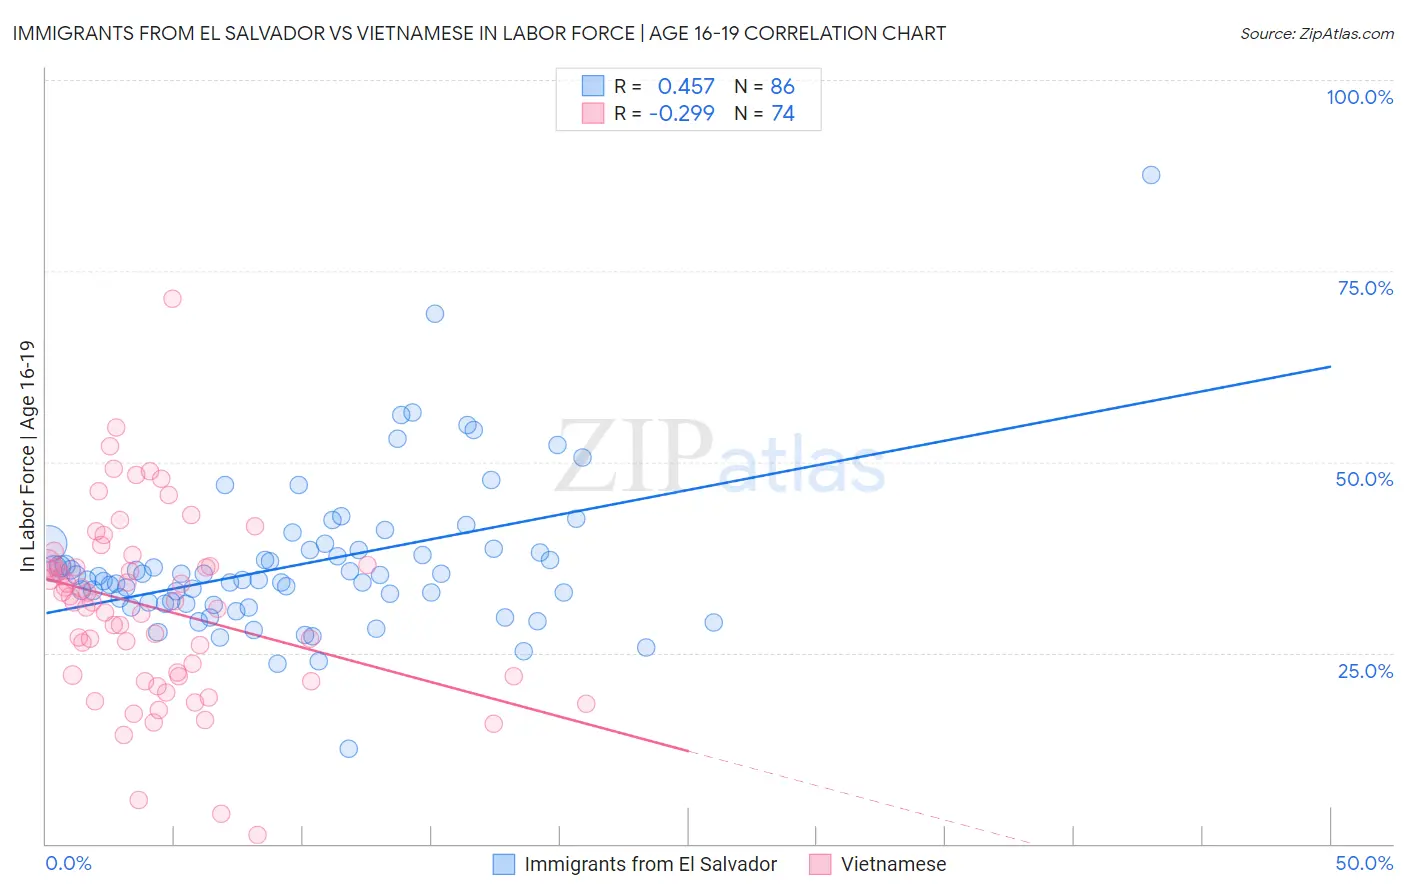
Immigrants from El Salvador vs Vietnamese In Labor Force | Age 16-19 Correlation Chart
The statistical analysis conducted on geographies consisting of 357,322,465 people shows a moderate positive correlation between the proportion of Immigrants from El Salvador and labor force participation rate among population between the ages 16 and 19 in the United States with a correlation coefficient (R) of 0.457 and weighted average of 34.3%. Similarly, the statistical analysis conducted on geographies consisting of 170,670,712 people shows a weak negative correlation between the proportion of Vietnamese and labor force participation rate among population between the ages 16 and 19 in the United States with a correlation coefficient (R) of -0.299 and weighted average of 29.6%, a difference of 16.1%.
In Labor Force | Age 16-19 Correlation Summary
| Measurement | Immigrants from El Salvador | Vietnamese |
| Minimum | 12.4% | 1.1% |
| Maximum | 87.5% | 71.4% |
| Range | 75.1% | 70.3% |
| Mean | 36.7% | 30.9% |
| Median | 34.8% | 31.6% |
| Interquartile 25% (IQ1) | 31.4% | 22.0% |
| Interquartile 75% (IQ3) | 38.5% | 36.5% |
| Interquartile Range (IQR) | 7.1% | 14.5% |
| Standard Deviation (Sample) | 10.1% | 12.0% |
| Standard Deviation (Population) | 10.0% | 11.9% |
Similar Demographics by In Labor Force | Age 16-19
Demographics Similar to Immigrants from El Salvador by In Labor Force | Age 16-19
In terms of in labor force | age 16-19, the demographic groups most similar to Immigrants from El Salvador are Immigrants from Malaysia (34.3%, a difference of 0.090%), Immigrants from Uruguay (34.4%, a difference of 0.24%), Immigrants from Peru (34.2%, a difference of 0.44%), Burmese (34.5%, a difference of 0.53%), and Immigrants from Asia (34.1%, a difference of 0.56%).
| Demographics | Rating | Rank | In Labor Force | Age 16-19 |
| Thais | 1.2 /100 | #258 | Tragic 34.6% |
| Immigrants | Immigrants | 1.2 /100 | #259 | Tragic 34.6% |
| Egyptians | 1.2 /100 | #260 | Tragic 34.5% |
| Salvadorans | 1.1 /100 | #261 | Tragic 34.5% |
| Hispanics or Latinos | 1.1 /100 | #262 | Tragic 34.5% |
| Burmese | 1.1 /100 | #263 | Tragic 34.5% |
| Immigrants | Uruguay | 0.9 /100 | #264 | Tragic 34.4% |
| Immigrants | El Salvador | 0.7 /100 | #265 | Tragic 34.3% |
| Immigrants | Malaysia | 0.7 /100 | #266 | Tragic 34.3% |
| Immigrants | Peru | 0.5 /100 | #267 | Tragic 34.2% |
| Immigrants | Asia | 0.5 /100 | #268 | Tragic 34.1% |
| Pima | 0.5 /100 | #269 | Tragic 34.1% |
| Immigrants | Russia | 0.4 /100 | #270 | Tragic 34.1% |
| Central American Indians | 0.4 /100 | #271 | Tragic 34.1% |
| Asians | 0.4 /100 | #272 | Tragic 34.1% |
Demographics Similar to Vietnamese by In Labor Force | Age 16-19
In terms of in labor force | age 16-19, the demographic groups most similar to Vietnamese are Immigrants from Uzbekistan (29.2%, a difference of 1.4%), British West Indian (29.1%, a difference of 1.6%), Immigrants from Bangladesh (30.0%, a difference of 1.7%), Immigrants from Armenia (29.0%, a difference of 1.8%), and Immigrants from Barbados (29.0%, a difference of 2.0%).
| Demographics | Rating | Rank | In Labor Force | Age 16-19 |
| Trinidadians and Tobagonians | 0.0 /100 | #331 | Tragic 30.9% |
| Immigrants | Israel | 0.0 /100 | #332 | Tragic 30.5% |
| Immigrants | Hong Kong | 0.0 /100 | #333 | Tragic 30.5% |
| Puerto Ricans | 0.0 /100 | #334 | Tragic 30.3% |
| Immigrants | Cuba | 0.0 /100 | #335 | Tragic 30.2% |
| Immigrants | Trinidad and Tobago | 0.0 /100 | #336 | Tragic 30.2% |
| Immigrants | Bangladesh | 0.0 /100 | #337 | Tragic 30.0% |
| Vietnamese | 0.0 /100 | #338 | Tragic 29.6% |
| Immigrants | Uzbekistan | 0.0 /100 | #339 | Tragic 29.2% |
| British West Indians | 0.0 /100 | #340 | Tragic 29.1% |
| Immigrants | Armenia | 0.0 /100 | #341 | Tragic 29.0% |
| Immigrants | Barbados | 0.0 /100 | #342 | Tragic 29.0% |
| Yuman | 0.0 /100 | #343 | Tragic 27.7% |
| Guyanese | 0.0 /100 | #344 | Tragic 27.4% |
| Immigrants | Guyana | 0.0 /100 | #345 | Tragic 27.3% |