Immigrants from Bolivia vs American In Labor Force | Age 30-34
COMPARE
Immigrants from Bolivia
American
In Labor Force | Age 30-34
In Labor Force | Age 30-34 Comparison
Immigrants from Bolivia
Americans
86.2%
IN LABOR FORCE | AGE 30-34
100.0/ 100
METRIC RATING
7th/ 347
METRIC RANK
82.7%
IN LABOR FORCE | AGE 30-34
0.0/ 100
METRIC RATING
294th/ 347
METRIC RANK
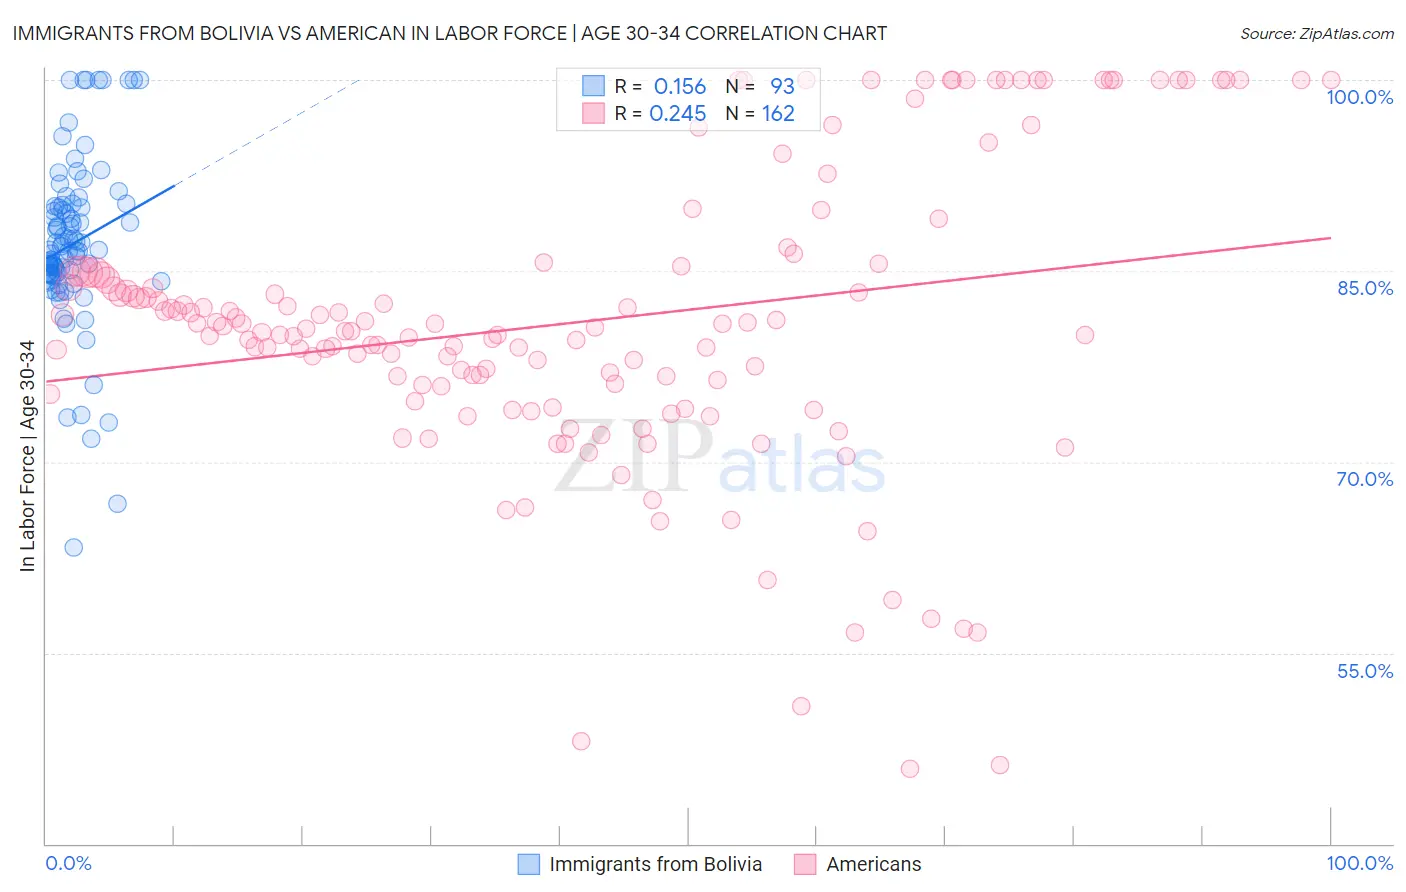
Immigrants from Bolivia vs American In Labor Force | Age 30-34 Correlation Chart
The statistical analysis conducted on geographies consisting of 158,707,653 people shows a poor positive correlation between the proportion of Immigrants from Bolivia and labor force participation rate among population between the ages 30 and 34 in the United States with a correlation coefficient (R) of 0.156 and weighted average of 86.2%. Similarly, the statistical analysis conducted on geographies consisting of 580,133,511 people shows a weak positive correlation between the proportion of Americans and labor force participation rate among population between the ages 30 and 34 in the United States with a correlation coefficient (R) of 0.245 and weighted average of 82.7%, a difference of 4.3%.
In Labor Force | Age 30-34 Correlation Summary
| Measurement | Immigrants from Bolivia | American |
| Minimum | 63.3% | 45.9% |
| Maximum | 100.0% | 100.0% |
| Range | 36.7% | 54.1% |
| Mean | 87.1% | 81.0% |
| Median | 86.7% | 80.4% |
| Interquartile 25% (IQ1) | 84.7% | 75.9% |
| Interquartile 75% (IQ3) | 90.2% | 85.0% |
| Interquartile Range (IQR) | 5.5% | 9.0% |
| Standard Deviation (Sample) | 6.7% | 11.6% |
| Standard Deviation (Population) | 6.7% | 11.6% |
Similar Demographics by In Labor Force | Age 30-34
Demographics Similar to Immigrants from Bolivia by In Labor Force | Age 30-34
In terms of in labor force | age 30-34, the demographic groups most similar to Immigrants from Bolivia are Somali (86.2%, a difference of 0.010%), Cambodian (86.2%, a difference of 0.010%), Immigrants from Somalia (86.2%, a difference of 0.020%), Immigrants from Ireland (86.3%, a difference of 0.040%), and Immigrants from Serbia (86.2%, a difference of 0.060%).
| Demographics | Rating | Rank | In Labor Force | Age 30-34 |
| Luxembourgers | 100.0 /100 | #1 | Exceptional 86.6% |
| Ethiopians | 100.0 /100 | #2 | Exceptional 86.6% |
| Immigrants | Ethiopia | 100.0 /100 | #3 | Exceptional 86.6% |
| Liberians | 100.0 /100 | #4 | Exceptional 86.4% |
| Immigrants | Ireland | 100.0 /100 | #5 | Exceptional 86.3% |
| Somalis | 100.0 /100 | #6 | Exceptional 86.2% |
| Immigrants | Bolivia | 100.0 /100 | #7 | Exceptional 86.2% |
| Cambodians | 100.0 /100 | #8 | Exceptional 86.2% |
| Immigrants | Somalia | 100.0 /100 | #9 | Exceptional 86.2% |
| Immigrants | Serbia | 100.0 /100 | #10 | Exceptional 86.2% |
| Carpatho Rusyns | 100.0 /100 | #11 | Exceptional 86.2% |
| Bolivians | 100.0 /100 | #12 | Exceptional 86.1% |
| Immigrants | Croatia | 100.0 /100 | #13 | Exceptional 86.1% |
| Immigrants | Cabo Verde | 100.0 /100 | #14 | Exceptional 86.1% |
| Immigrants | Albania | 100.0 /100 | #15 | Exceptional 86.1% |
Demographics Similar to Americans by In Labor Force | Age 30-34
In terms of in labor force | age 30-34, the demographic groups most similar to Americans are Nepalese (82.7%, a difference of 0.020%), Black/African American (82.8%, a difference of 0.090%), Potawatomi (82.8%, a difference of 0.11%), Pennsylvania German (82.6%, a difference of 0.12%), and Blackfeet (82.8%, a difference of 0.13%).
| Demographics | Rating | Rank | In Labor Force | Age 30-34 |
| Native Hawaiians | 0.0 /100 | #287 | Tragic 83.0% |
| Central American Indians | 0.0 /100 | #288 | Tragic 83.0% |
| Hawaiians | 0.0 /100 | #289 | Tragic 83.0% |
| Blackfeet | 0.0 /100 | #290 | Tragic 82.8% |
| Potawatomi | 0.0 /100 | #291 | Tragic 82.8% |
| Blacks/African Americans | 0.0 /100 | #292 | Tragic 82.8% |
| Nepalese | 0.0 /100 | #293 | Tragic 82.7% |
| Americans | 0.0 /100 | #294 | Tragic 82.7% |
| Pennsylvania Germans | 0.0 /100 | #295 | Tragic 82.6% |
| Chippewa | 0.0 /100 | #296 | Tragic 82.6% |
| Comanche | 0.0 /100 | #297 | Tragic 82.6% |
| Aleuts | 0.0 /100 | #298 | Tragic 82.6% |
| Immigrants | Central America | 0.0 /100 | #299 | Tragic 82.5% |
| Hmong | 0.0 /100 | #300 | Tragic 82.4% |
| Hispanics or Latinos | 0.0 /100 | #301 | Tragic 82.4% |