Luxembourger vs Ecuadorian In Labor Force | Age 45-54
COMPARE
Luxembourger
Ecuadorian
In Labor Force | Age 45-54
In Labor Force | Age 45-54 Comparison
Luxembourgers
Ecuadorians
85.0%
IN LABOR FORCE | AGE 45-54
100.0/ 100
METRIC RATING
2nd/ 347
METRIC RANK
82.3%
IN LABOR FORCE | AGE 45-54
6.3/ 100
METRIC RATING
212th/ 347
METRIC RANK
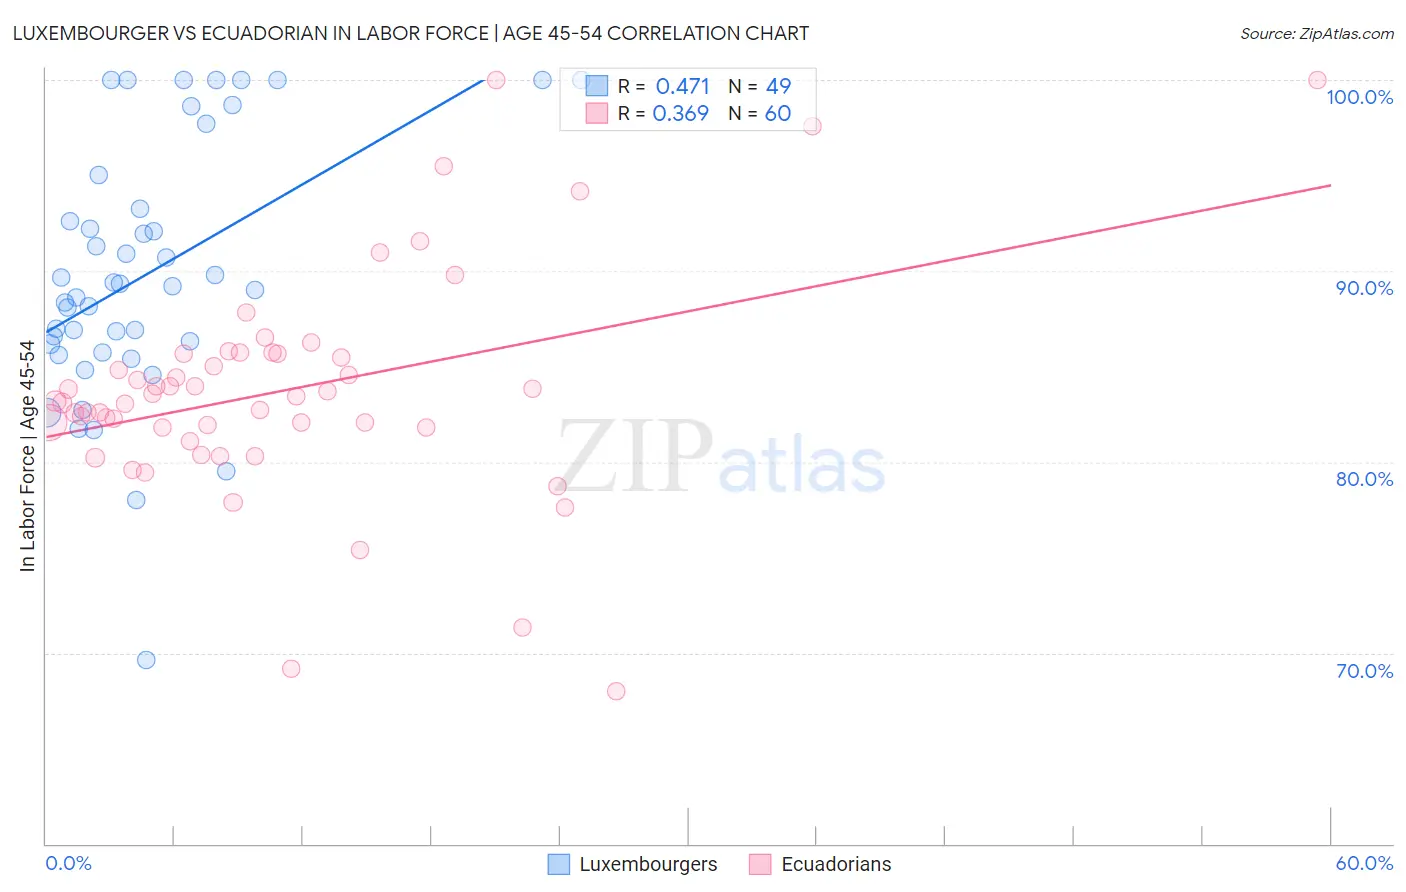
Luxembourger vs Ecuadorian In Labor Force | Age 45-54 Correlation Chart
The statistical analysis conducted on geographies consisting of 144,640,644 people shows a moderate positive correlation between the proportion of Luxembourgers and labor force participation rate among population between the ages 45 and 54 in the United States with a correlation coefficient (R) of 0.471 and weighted average of 85.0%. Similarly, the statistical analysis conducted on geographies consisting of 317,622,832 people shows a mild positive correlation between the proportion of Ecuadorians and labor force participation rate among population between the ages 45 and 54 in the United States with a correlation coefficient (R) of 0.369 and weighted average of 82.3%, a difference of 3.3%.
In Labor Force | Age 45-54 Correlation Summary
| Measurement | Luxembourger | Ecuadorian |
| Minimum | 69.6% | 68.0% |
| Maximum | 100.0% | 100.0% |
| Range | 30.4% | 32.0% |
| Mean | 89.9% | 83.8% |
| Median | 89.2% | 83.3% |
| Interquartile 25% (IQ1) | 85.9% | 81.8% |
| Interquartile 75% (IQ3) | 94.1% | 85.7% |
| Interquartile Range (IQR) | 8.2% | 3.9% |
| Standard Deviation (Sample) | 6.8% | 5.9% |
| Standard Deviation (Population) | 6.7% | 5.9% |
Similar Demographics by In Labor Force | Age 45-54
Demographics Similar to Luxembourgers by In Labor Force | Age 45-54
In terms of in labor force | age 45-54, the demographic groups most similar to Luxembourgers are Bolivian (84.9%, a difference of 0.090%), Immigrants from Ethiopia (84.8%, a difference of 0.21%), Ethiopian (84.8%, a difference of 0.29%), Immigrants from Bolivia (85.3%, a difference of 0.34%), and Immigrants from India (84.7%, a difference of 0.40%).
| Demographics | Rating | Rank | In Labor Force | Age 45-54 |
| Immigrants | Bolivia | 100.0 /100 | #1 | Exceptional 85.3% |
| Luxembourgers | 100.0 /100 | #2 | Exceptional 85.0% |
| Bolivians | 100.0 /100 | #3 | Exceptional 84.9% |
| Immigrants | Ethiopia | 100.0 /100 | #4 | Exceptional 84.8% |
| Ethiopians | 100.0 /100 | #5 | Exceptional 84.8% |
| Immigrants | India | 100.0 /100 | #6 | Exceptional 84.7% |
| Immigrants | Cameroon | 100.0 /100 | #7 | Exceptional 84.6% |
| Sierra Leoneans | 100.0 /100 | #8 | Exceptional 84.5% |
| Immigrants | Sierra Leone | 100.0 /100 | #9 | Exceptional 84.4% |
| Norwegians | 100.0 /100 | #10 | Exceptional 84.4% |
| Thais | 100.0 /100 | #11 | Exceptional 84.3% |
| Bulgarians | 100.0 /100 | #12 | Exceptional 84.2% |
| Chinese | 99.9 /100 | #13 | Exceptional 84.1% |
| Cambodians | 99.9 /100 | #14 | Exceptional 84.1% |
| Cypriots | 99.9 /100 | #15 | Exceptional 84.1% |
Demographics Similar to Ecuadorians by In Labor Force | Age 45-54
In terms of in labor force | age 45-54, the demographic groups most similar to Ecuadorians are Immigrants from Syria (82.3%, a difference of 0.010%), Immigrants from Uzbekistan (82.3%, a difference of 0.020%), Immigrants from Bahamas (82.3%, a difference of 0.030%), Immigrants from Panama (82.2%, a difference of 0.030%), and Iraqi (82.2%, a difference of 0.030%).
| Demographics | Rating | Rank | In Labor Force | Age 45-54 |
| Senegalese | 9.5 /100 | #205 | Tragic 82.4% |
| Welsh | 9.2 /100 | #206 | Tragic 82.3% |
| Immigrants | Cabo Verde | 8.6 /100 | #207 | Tragic 82.3% |
| Native Hawaiians | 8.5 /100 | #208 | Tragic 82.3% |
| Immigrants | Lebanon | 7.4 /100 | #209 | Tragic 82.3% |
| Immigrants | Bahamas | 7.1 /100 | #210 | Tragic 82.3% |
| Immigrants | Syria | 6.6 /100 | #211 | Tragic 82.3% |
| Ecuadorians | 6.3 /100 | #212 | Tragic 82.3% |
| Immigrants | Uzbekistan | 5.8 /100 | #213 | Tragic 82.3% |
| Immigrants | Panama | 5.6 /100 | #214 | Tragic 82.2% |
| Iraqis | 5.6 /100 | #215 | Tragic 82.2% |
| Scottish | 5.3 /100 | #216 | Tragic 82.2% |
| Portuguese | 4.7 /100 | #217 | Tragic 82.2% |
| English | 4.4 /100 | #218 | Tragic 82.2% |
| French | 4.1 /100 | #219 | Tragic 82.2% |