Afghan vs Colombian In Labor Force | Age 35-44
COMPARE
Afghan
Colombian
In Labor Force | Age 35-44
In Labor Force | Age 35-44 Comparison
Afghans
Colombians
84.6%
IN LABOR FORCE | AGE 35-44
86.3/ 100
METRIC RATING
136th/ 347
METRIC RANK
85.0%
IN LABOR FORCE | AGE 35-44
98.8/ 100
METRIC RATING
74th/ 347
METRIC RANK
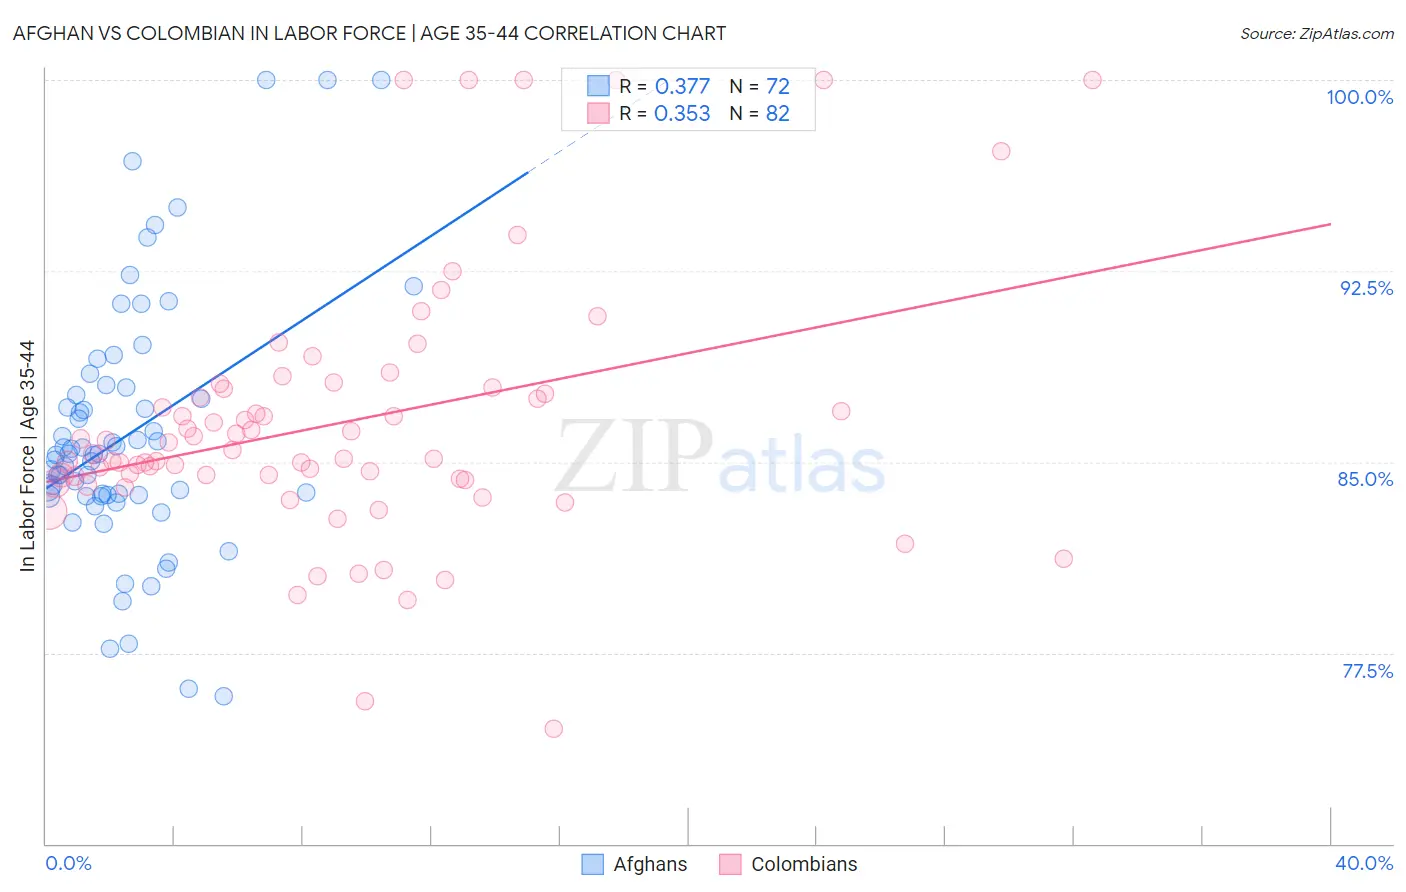
Afghan vs Colombian In Labor Force | Age 35-44 Correlation Chart
The statistical analysis conducted on geographies consisting of 148,851,907 people shows a mild positive correlation between the proportion of Afghans and labor force participation rate among population between the ages 35 and 44 in the United States with a correlation coefficient (R) of 0.377 and weighted average of 84.6%. Similarly, the statistical analysis conducted on geographies consisting of 419,405,199 people shows a mild positive correlation between the proportion of Colombians and labor force participation rate among population between the ages 35 and 44 in the United States with a correlation coefficient (R) of 0.353 and weighted average of 85.0%, a difference of 0.41%.
In Labor Force | Age 35-44 Correlation Summary
| Measurement | Afghan | Colombian |
| Minimum | 75.8% | 74.5% |
| Maximum | 100.0% | 100.0% |
| Range | 24.2% | 25.5% |
| Mean | 86.1% | 86.6% |
| Median | 85.3% | 85.4% |
| Interquartile 25% (IQ1) | 83.7% | 84.3% |
| Interquartile 75% (IQ3) | 87.8% | 87.9% |
| Interquartile Range (IQR) | 4.1% | 3.6% |
| Standard Deviation (Sample) | 5.0% | 5.1% |
| Standard Deviation (Population) | 5.0% | 5.1% |
Similar Demographics by In Labor Force | Age 35-44
Demographics Similar to Afghans by In Labor Force | Age 35-44
In terms of in labor force | age 35-44, the demographic groups most similar to Afghans are Immigrants from Malaysia (84.6%, a difference of 0.020%), Immigrants from Chile (84.6%, a difference of 0.020%), Argentinean (84.6%, a difference of 0.030%), Immigrants from Korea (84.6%, a difference of 0.030%), and Czechoslovakian (84.6%, a difference of 0.040%).
| Demographics | Rating | Rank | In Labor Force | Age 35-44 |
| Palestinians | 89.7 /100 | #129 | Excellent 84.7% |
| Bhutanese | 89.7 /100 | #130 | Excellent 84.7% |
| Immigrants | Scotland | 89.6 /100 | #131 | Excellent 84.7% |
| Austrians | 89.4 /100 | #132 | Excellent 84.7% |
| Argentineans | 88.4 /100 | #133 | Excellent 84.6% |
| Immigrants | Korea | 88.2 /100 | #134 | Excellent 84.6% |
| Immigrants | Malaysia | 87.5 /100 | #135 | Excellent 84.6% |
| Afghans | 86.3 /100 | #136 | Excellent 84.6% |
| Immigrants | Chile | 84.6 /100 | #137 | Excellent 84.6% |
| Czechoslovakians | 82.6 /100 | #138 | Excellent 84.6% |
| Immigrants | Zaire | 82.5 /100 | #139 | Excellent 84.6% |
| Immigrants | Japan | 81.4 /100 | #140 | Excellent 84.6% |
| Immigrants | Belgium | 80.8 /100 | #141 | Excellent 84.6% |
| Immigrants | Uruguay | 80.1 /100 | #142 | Excellent 84.6% |
| Immigrants | Ukraine | 79.7 /100 | #143 | Good 84.6% |
Demographics Similar to Colombians by In Labor Force | Age 35-44
In terms of in labor force | age 35-44, the demographic groups most similar to Colombians are Immigrants from Singapore (85.0%, a difference of 0.010%), Immigrants from Sri Lanka (85.0%, a difference of 0.010%), Immigrants from South Central Asia (85.0%, a difference of 0.010%), Immigrants from Cuba (84.9%, a difference of 0.020%), and Immigrants from Turkey (84.9%, a difference of 0.020%).
| Demographics | Rating | Rank | In Labor Force | Age 35-44 |
| Immigrants | Italy | 99.1 /100 | #67 | Exceptional 85.0% |
| Italians | 99.1 /100 | #68 | Exceptional 85.0% |
| Sudanese | 99.0 /100 | #69 | Exceptional 85.0% |
| Brazilians | 99.0 /100 | #70 | Exceptional 85.0% |
| Russians | 99.0 /100 | #71 | Exceptional 85.0% |
| Immigrants | Singapore | 98.9 /100 | #72 | Exceptional 85.0% |
| Immigrants | Sri Lanka | 98.9 /100 | #73 | Exceptional 85.0% |
| Colombians | 98.8 /100 | #74 | Exceptional 85.0% |
| Immigrants | South Central Asia | 98.7 /100 | #75 | Exceptional 85.0% |
| Immigrants | Cuba | 98.6 /100 | #76 | Exceptional 84.9% |
| Immigrants | Turkey | 98.6 /100 | #77 | Exceptional 84.9% |
| Immigrants | Africa | 98.4 /100 | #78 | Exceptional 84.9% |
| Peruvians | 98.3 /100 | #79 | Exceptional 84.9% |
| Immigrants | Colombia | 98.3 /100 | #80 | Exceptional 84.9% |
| Immigrants | Eastern Europe | 98.3 /100 | #81 | Exceptional 84.9% |