Immigrants from Canada vs Filipino In Labor Force | Age 45-54
COMPARE
Immigrants from Canada
Filipino
In Labor Force | Age 45-54
In Labor Force | Age 45-54 Comparison
Immigrants from Canada
Filipinos
82.5%
IN LABOR FORCE | AGE 45-54
20.0/ 100
METRIC RATING
195th/ 347
METRIC RANK
83.5%
IN LABOR FORCE | AGE 45-54
98.3/ 100
METRIC RATING
61st/ 347
METRIC RANK
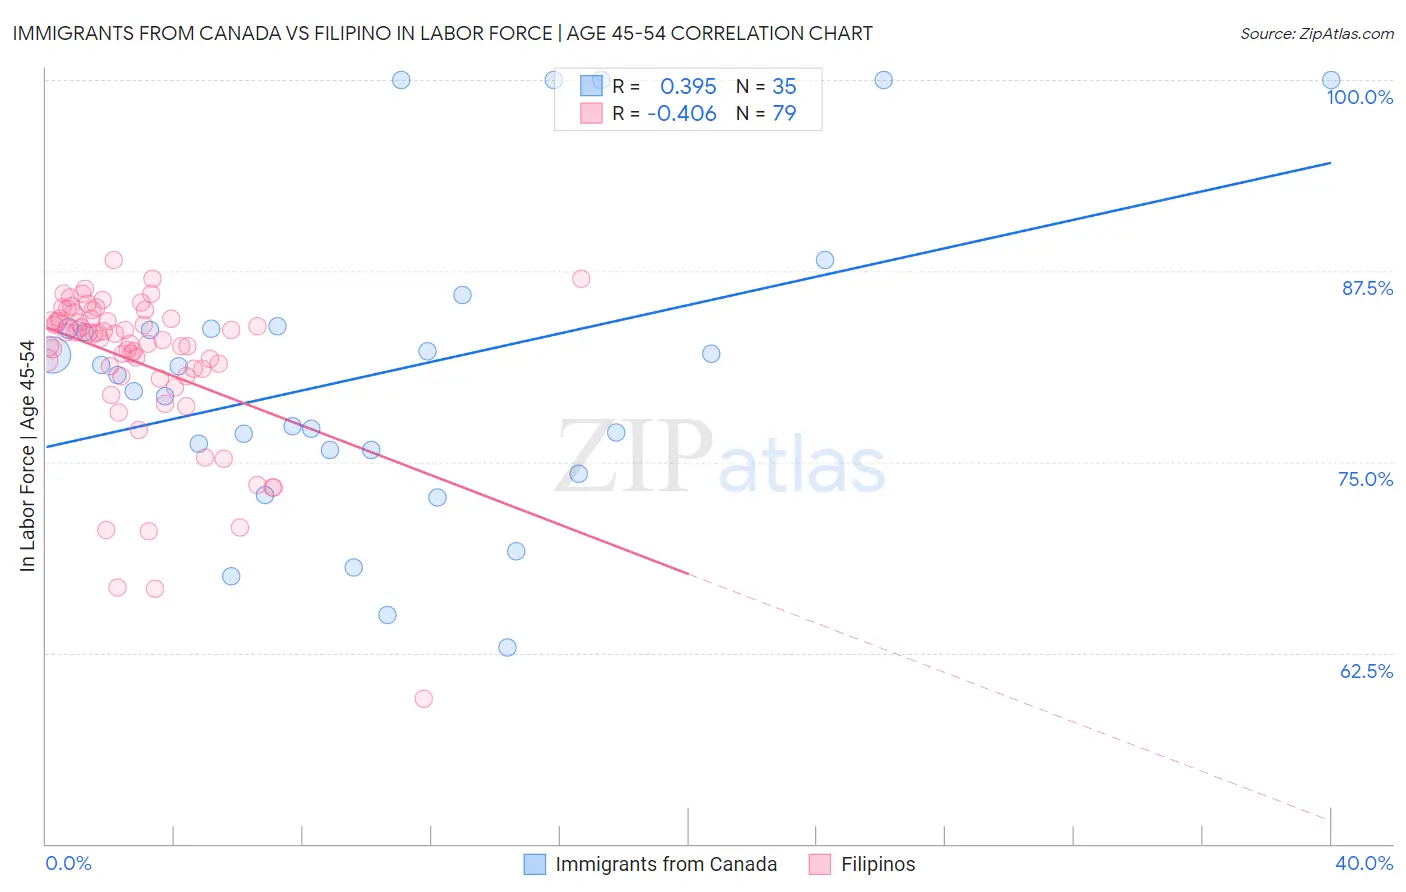
Immigrants from Canada vs Filipino In Labor Force | Age 45-54 Correlation Chart
The statistical analysis conducted on geographies consisting of 459,096,447 people shows a mild positive correlation between the proportion of Immigrants from Canada and labor force participation rate among population between the ages 45 and 54 in the United States with a correlation coefficient (R) of 0.395 and weighted average of 82.5%. Similarly, the statistical analysis conducted on geographies consisting of 254,168,663 people shows a moderate negative correlation between the proportion of Filipinos and labor force participation rate among population between the ages 45 and 54 in the United States with a correlation coefficient (R) of -0.406 and weighted average of 83.5%, a difference of 1.2%.
In Labor Force | Age 45-54 Correlation Summary
| Measurement | Immigrants from Canada | Filipino |
| Minimum | 62.8% | 59.5% |
| Maximum | 100.0% | 88.2% |
| Range | 37.2% | 28.7% |
| Mean | 80.8% | 81.5% |
| Median | 80.7% | 83.4% |
| Interquartile 25% (IQ1) | 75.8% | 80.6% |
| Interquartile 75% (IQ3) | 83.7% | 84.4% |
| Interquartile Range (IQR) | 8.0% | 3.8% |
| Standard Deviation (Sample) | 9.9% | 5.2% |
| Standard Deviation (Population) | 9.7% | 5.1% |
Similar Demographics by In Labor Force | Age 45-54
Demographics Similar to Immigrants from Canada by In Labor Force | Age 45-54
In terms of in labor force | age 45-54, the demographic groups most similar to Immigrants from Canada are Immigrants from Iraq (82.5%, a difference of 0.010%), Australian (82.5%, a difference of 0.010%), Immigrants from Norway (82.5%, a difference of 0.010%), Immigrants from North America (82.5%, a difference of 0.020%), and Lebanese (82.5%, a difference of 0.030%).
| Demographics | Rating | Rank | In Labor Force | Age 45-54 |
| South Africans | 28.0 /100 | #188 | Fair 82.6% |
| Syrians | 26.0 /100 | #189 | Fair 82.6% |
| British | 25.7 /100 | #190 | Fair 82.6% |
| Armenians | 23.2 /100 | #191 | Fair 82.5% |
| Immigrants | Iraq | 20.9 /100 | #192 | Fair 82.5% |
| Australians | 20.8 /100 | #193 | Fair 82.5% |
| Immigrants | Norway | 20.7 /100 | #194 | Fair 82.5% |
| Immigrants | Canada | 20.0 /100 | #195 | Fair 82.5% |
| Immigrants | North America | 18.8 /100 | #196 | Poor 82.5% |
| Lebanese | 18.2 /100 | #197 | Poor 82.5% |
| Immigrants | Denmark | 17.9 /100 | #198 | Poor 82.5% |
| Moroccans | 15.7 /100 | #199 | Poor 82.5% |
| French Canadians | 15.4 /100 | #200 | Poor 82.5% |
| Canadians | 15.1 /100 | #201 | Poor 82.4% |
| Immigrants | Western Asia | 14.9 /100 | #202 | Poor 82.4% |
Demographics Similar to Filipinos by In Labor Force | Age 45-54
In terms of in labor force | age 45-54, the demographic groups most similar to Filipinos are Carpatho Rusyn (83.5%, a difference of 0.0%), Bhutanese (83.5%, a difference of 0.010%), Eastern European (83.5%, a difference of 0.020%), Paraguayan (83.5%, a difference of 0.030%), and Immigrants from Taiwan (83.5%, a difference of 0.030%).
| Demographics | Rating | Rank | In Labor Force | Age 45-54 |
| Somalis | 98.7 /100 | #54 | Exceptional 83.5% |
| Macedonians | 98.7 /100 | #55 | Exceptional 83.5% |
| Immigrants | Peru | 98.6 /100 | #56 | Exceptional 83.5% |
| Paraguayans | 98.5 /100 | #57 | Exceptional 83.5% |
| Eastern Europeans | 98.5 /100 | #58 | Exceptional 83.5% |
| Bhutanese | 98.3 /100 | #59 | Exceptional 83.5% |
| Carpatho Rusyns | 98.3 /100 | #60 | Exceptional 83.5% |
| Filipinos | 98.3 /100 | #61 | Exceptional 83.5% |
| Immigrants | Taiwan | 98.0 /100 | #62 | Exceptional 83.5% |
| Afghans | 97.9 /100 | #63 | Exceptional 83.5% |
| Immigrants | Kenya | 97.9 /100 | #64 | Exceptional 83.5% |
| Egyptians | 97.9 /100 | #65 | Exceptional 83.5% |
| Asians | 97.7 /100 | #66 | Exceptional 83.4% |
| Chileans | 97.7 /100 | #67 | Exceptional 83.4% |
| Immigrants | Colombia | 97.6 /100 | #68 | Exceptional 83.4% |