Jamaican vs Salvadoran Unemployment Among Seniors over 65 years
COMPARE
Jamaican
Salvadoran
Unemployment Among Seniors over 65 years
Unemployment Among Seniors over 65 years Comparison
Jamaicans
Salvadorans
5.5%
UNEMPLOYMENT AMONG SENIORS OVER 65 YEARS
0.0/ 100
METRIC RATING
290th/ 347
METRIC RANK
5.6%
UNEMPLOYMENT AMONG SENIORS OVER 65 YEARS
0.0/ 100
METRIC RATING
310th/ 347
METRIC RANK
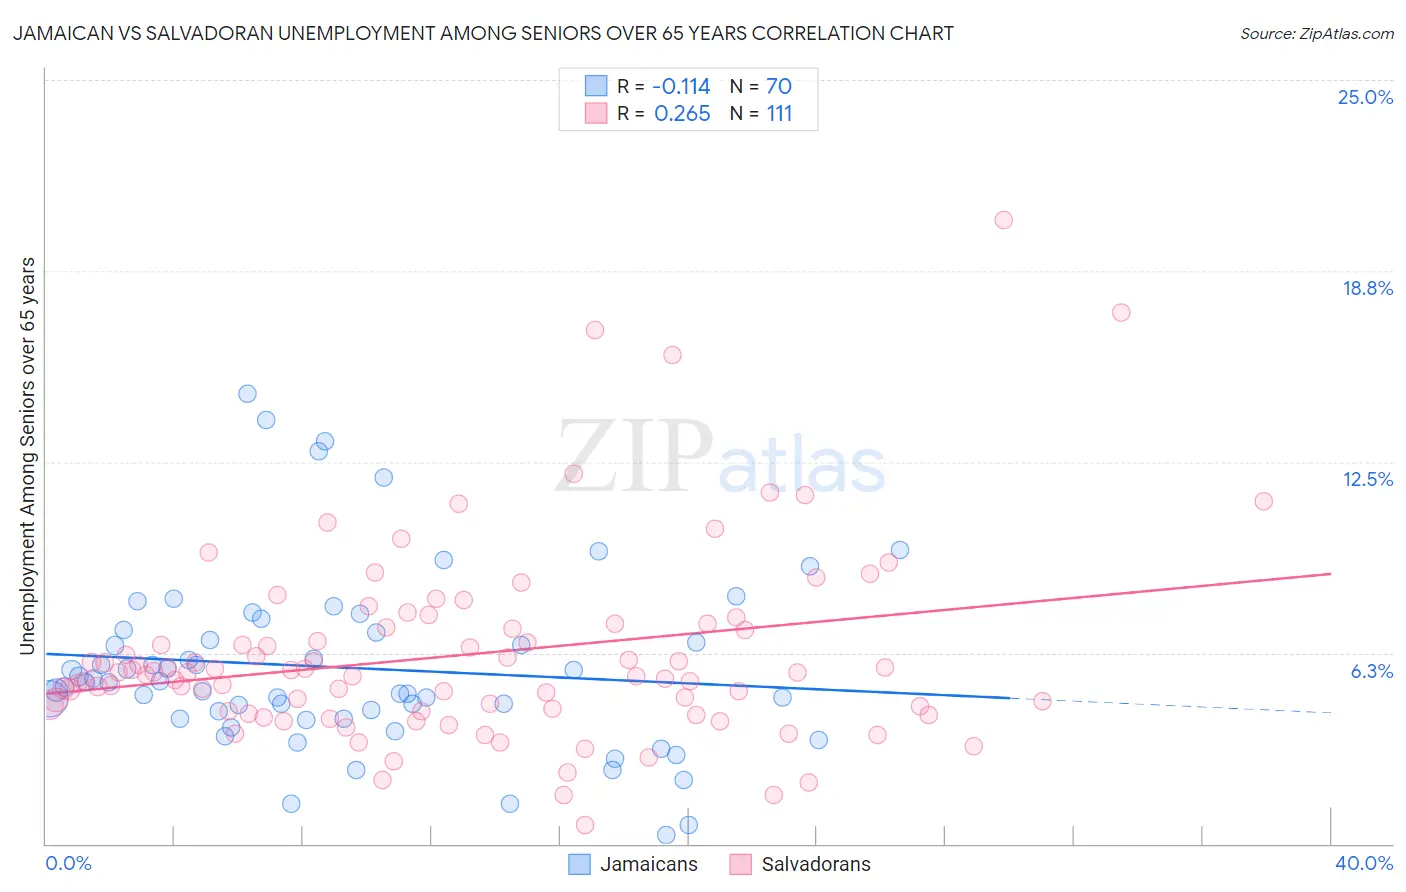
Jamaican vs Salvadoran Unemployment Among Seniors over 65 years Correlation Chart
The statistical analysis conducted on geographies consisting of 334,673,219 people shows a poor negative correlation between the proportion of Jamaicans and unemployment rate amomg seniors over the age of 65 in the United States with a correlation coefficient (R) of -0.114 and weighted average of 5.5%. Similarly, the statistical analysis conducted on geographies consisting of 359,194,343 people shows a weak positive correlation between the proportion of Salvadorans and unemployment rate amomg seniors over the age of 65 in the United States with a correlation coefficient (R) of 0.265 and weighted average of 5.6%, a difference of 1.8%.
Unemployment Among Seniors over 65 years Correlation Summary
| Measurement | Jamaican | Salvadoran |
| Minimum | 0.30% | 0.60% |
| Maximum | 14.7% | 20.4% |
| Range | 14.4% | 19.8% |
| Mean | 5.8% | 6.2% |
| Median | 5.3% | 5.6% |
| Interquartile 25% (IQ1) | 4.1% | 4.3% |
| Interquartile 75% (IQ3) | 6.9% | 7.1% |
| Interquartile Range (IQR) | 2.8% | 2.7% |
| Standard Deviation (Sample) | 2.9% | 3.2% |
| Standard Deviation (Population) | 2.9% | 3.1% |
Demographics Similar to Jamaicans and Salvadorans by Unemployment Among Seniors over 65 years
In terms of unemployment among seniors over 65 years, the demographic groups most similar to Jamaicans are Black/African American (5.5%, a difference of 0.030%), Belizean (5.5%, a difference of 0.18%), Immigrants from Venezuela (5.5%, a difference of 0.22%), Armenian (5.5%, a difference of 0.26%), and Cheyenne (5.5%, a difference of 0.33%). Similarly, the demographic groups most similar to Salvadorans are Immigrants from Guatemala (5.6%, a difference of 0.040%), Immigrants from St. Vincent and the Grenadines (5.6%, a difference of 0.26%), Portuguese (5.6%, a difference of 0.34%), Ecuadorian (5.6%, a difference of 0.39%), and Mexican (5.6%, a difference of 0.44%).
| Demographics | Rating | Rank | Unemployment Among Seniors over 65 years |
| Jamaicans | 0.0 /100 | #290 | Tragic 5.5% |
| Blacks/African Americans | 0.0 /100 | #291 | Tragic 5.5% |
| Belizeans | 0.0 /100 | #292 | Tragic 5.5% |
| Immigrants | Venezuela | 0.0 /100 | #293 | Tragic 5.5% |
| Armenians | 0.0 /100 | #294 | Tragic 5.5% |
| Cheyenne | 0.0 /100 | #295 | Tragic 5.5% |
| Cape Verdeans | 0.0 /100 | #296 | Tragic 5.5% |
| Yaqui | 0.0 /100 | #297 | Tragic 5.5% |
| Immigrants | West Indies | 0.0 /100 | #298 | Tragic 5.6% |
| Guyanese | 0.0 /100 | #299 | Tragic 5.6% |
| Zimbabweans | 0.0 /100 | #300 | Tragic 5.6% |
| Hispanics or Latinos | 0.0 /100 | #301 | Tragic 5.6% |
| Guatemalans | 0.0 /100 | #302 | Tragic 5.6% |
| Immigrants | Latin America | 0.0 /100 | #303 | Tragic 5.6% |
| Liberians | 0.0 /100 | #304 | Tragic 5.6% |
| Mexicans | 0.0 /100 | #305 | Tragic 5.6% |
| Ecuadorians | 0.0 /100 | #306 | Tragic 5.6% |
| Portuguese | 0.0 /100 | #307 | Tragic 5.6% |
| Immigrants | St. Vincent and the Grenadines | 0.0 /100 | #308 | Tragic 5.6% |
| Immigrants | Guatemala | 0.0 /100 | #309 | Tragic 5.6% |
| Salvadorans | 0.0 /100 | #310 | Tragic 5.6% |