Indonesian vs Immigrants from France In Labor Force | Age 45-54
COMPARE
Indonesian
Immigrants from France
In Labor Force | Age 45-54
In Labor Force | Age 45-54 Comparison
Indonesians
Immigrants from France
81.5%
IN LABOR FORCE | AGE 45-54
0.1/ 100
METRIC RATING
263rd/ 347
METRIC RANK
83.0%
IN LABOR FORCE | AGE 45-54
75.3/ 100
METRIC RATING
146th/ 347
METRIC RANK
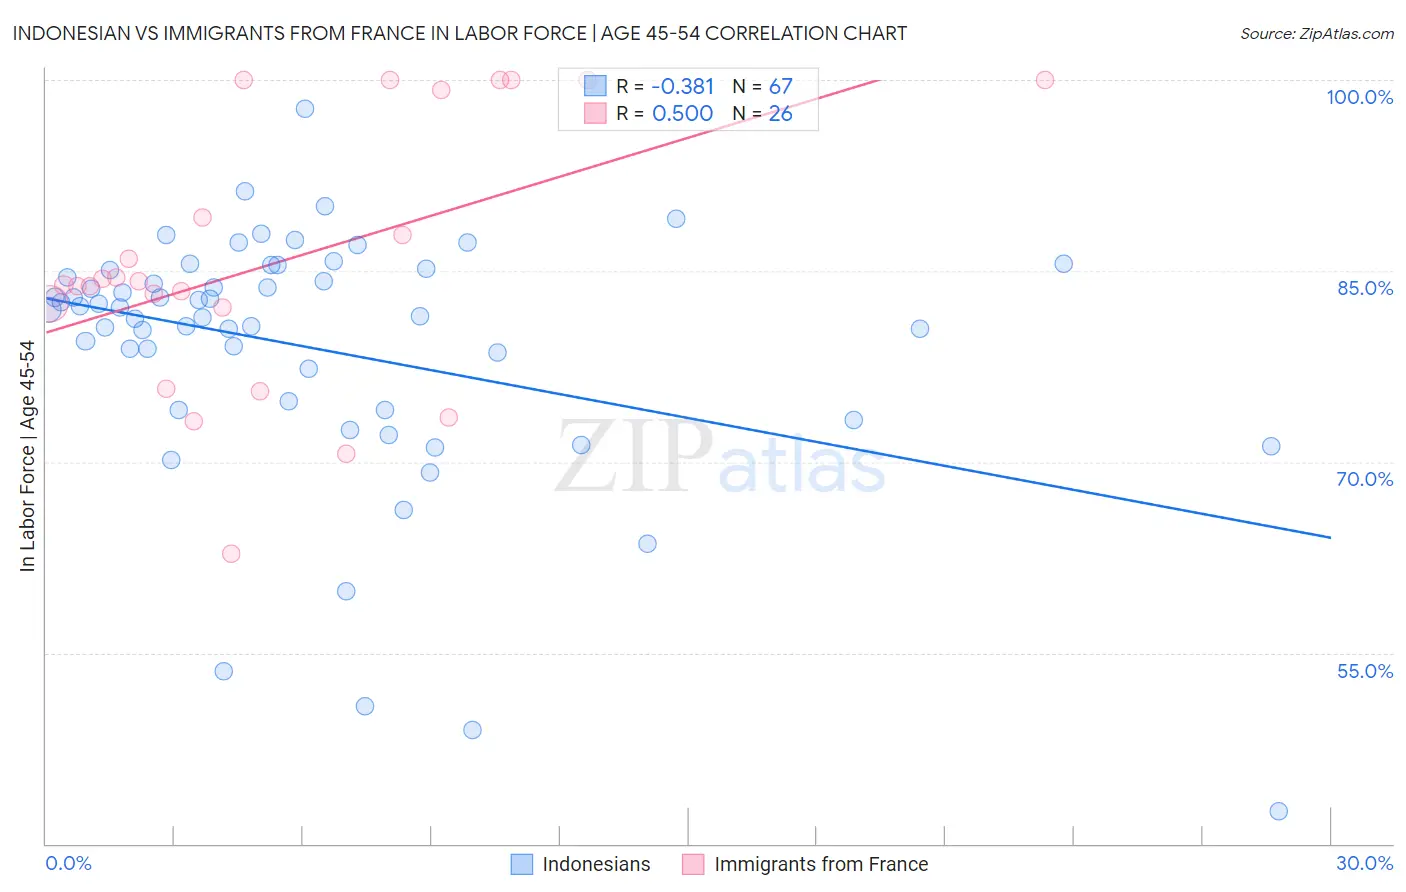
Indonesian vs Immigrants from France In Labor Force | Age 45-54 Correlation Chart
The statistical analysis conducted on geographies consisting of 162,640,204 people shows a mild negative correlation between the proportion of Indonesians and labor force participation rate among population between the ages 45 and 54 in the United States with a correlation coefficient (R) of -0.381 and weighted average of 81.5%. Similarly, the statistical analysis conducted on geographies consisting of 287,861,006 people shows a substantial positive correlation between the proportion of Immigrants from France and labor force participation rate among population between the ages 45 and 54 in the United States with a correlation coefficient (R) of 0.500 and weighted average of 83.0%, a difference of 1.8%.
In Labor Force | Age 45-54 Correlation Summary
| Measurement | Indonesian | Immigrants from France |
| Minimum | 42.6% | 62.8% |
| Maximum | 97.7% | 100.0% |
| Range | 55.1% | 37.2% |
| Mean | 78.8% | 85.7% |
| Median | 81.9% | 84.0% |
| Interquartile 25% (IQ1) | 74.1% | 82.2% |
| Interquartile 75% (IQ3) | 85.0% | 99.2% |
| Interquartile Range (IQR) | 10.9% | 17.0% |
| Standard Deviation (Sample) | 10.1% | 10.5% |
| Standard Deviation (Population) | 10.0% | 10.3% |
Similar Demographics by In Labor Force | Age 45-54
Demographics Similar to Indonesians by In Labor Force | Age 45-54
In terms of in labor force | age 45-54, the demographic groups most similar to Indonesians are Hawaiian (81.5%, a difference of 0.010%), Immigrants from Guyana (81.5%, a difference of 0.010%), Immigrants from West Indies (81.5%, a difference of 0.010%), Spaniard (81.5%, a difference of 0.030%), and Guyanese (81.5%, a difference of 0.050%).
| Demographics | Rating | Rank | In Labor Force | Age 45-54 |
| Barbadians | 0.1 /100 | #256 | Tragic 81.6% |
| Immigrants | Congo | 0.1 /100 | #257 | Tragic 81.6% |
| Immigrants | Fiji | 0.1 /100 | #258 | Tragic 81.5% |
| Guyanese | 0.1 /100 | #259 | Tragic 81.5% |
| Spaniards | 0.1 /100 | #260 | Tragic 81.5% |
| Hawaiians | 0.1 /100 | #261 | Tragic 81.5% |
| Immigrants | Guyana | 0.1 /100 | #262 | Tragic 81.5% |
| Indonesians | 0.1 /100 | #263 | Tragic 81.5% |
| Immigrants | West Indies | 0.1 /100 | #264 | Tragic 81.5% |
| Hondurans | 0.1 /100 | #265 | Tragic 81.4% |
| Immigrants | St. Vincent and the Grenadines | 0.1 /100 | #266 | Tragic 81.4% |
| West Indians | 0.1 /100 | #267 | Tragic 81.4% |
| Immigrants | Honduras | 0.0 /100 | #268 | Tragic 81.4% |
| Alsatians | 0.0 /100 | #269 | Tragic 81.3% |
| Bangladeshis | 0.0 /100 | #270 | Tragic 81.3% |
Demographics Similar to Immigrants from France by In Labor Force | Age 45-54
In terms of in labor force | age 45-54, the demographic groups most similar to Immigrants from France are Romanian (83.0%, a difference of 0.0%), Czechoslovakian (83.0%, a difference of 0.010%), Immigrants from Nigeria (83.0%, a difference of 0.010%), Okinawan (83.0%, a difference of 0.020%), and Soviet Union (83.0%, a difference of 0.020%).
| Demographics | Rating | Rank | In Labor Force | Age 45-54 |
| Scandinavians | 78.5 /100 | #139 | Good 83.0% |
| Yugoslavians | 78.3 /100 | #140 | Good 83.0% |
| Immigrants | Haiti | 77.9 /100 | #141 | Good 83.0% |
| Immigrants | Scotland | 77.8 /100 | #142 | Good 83.0% |
| Okinawans | 77.0 /100 | #143 | Good 83.0% |
| Soviet Union | 76.8 /100 | #144 | Good 83.0% |
| Romanians | 75.4 /100 | #145 | Good 83.0% |
| Immigrants | France | 75.3 /100 | #146 | Good 83.0% |
| Czechoslovakians | 74.8 /100 | #147 | Good 83.0% |
| Immigrants | Nigeria | 74.1 /100 | #148 | Good 83.0% |
| Immigrants | Sweden | 73.3 /100 | #149 | Good 82.9% |
| Immigrants | Netherlands | 72.6 /100 | #150 | Good 82.9% |
| Koreans | 71.9 /100 | #151 | Good 82.9% |
| Slavs | 71.5 /100 | #152 | Good 82.9% |
| Immigrants | Indonesia | 70.6 /100 | #153 | Good 82.9% |