Indonesian vs African In Labor Force | Age 20-64
COMPARE
Indonesian
African
In Labor Force | Age 20-64
In Labor Force | Age 20-64 Comparison
Indonesians
Africans
79.4%
IN LABOR FORCE | AGE 20-64
26.1/ 100
METRIC RATING
193rd/ 347
METRIC RANK
77.9%
IN LABOR FORCE | AGE 20-64
0.0/ 100
METRIC RATING
289th/ 347
METRIC RANK
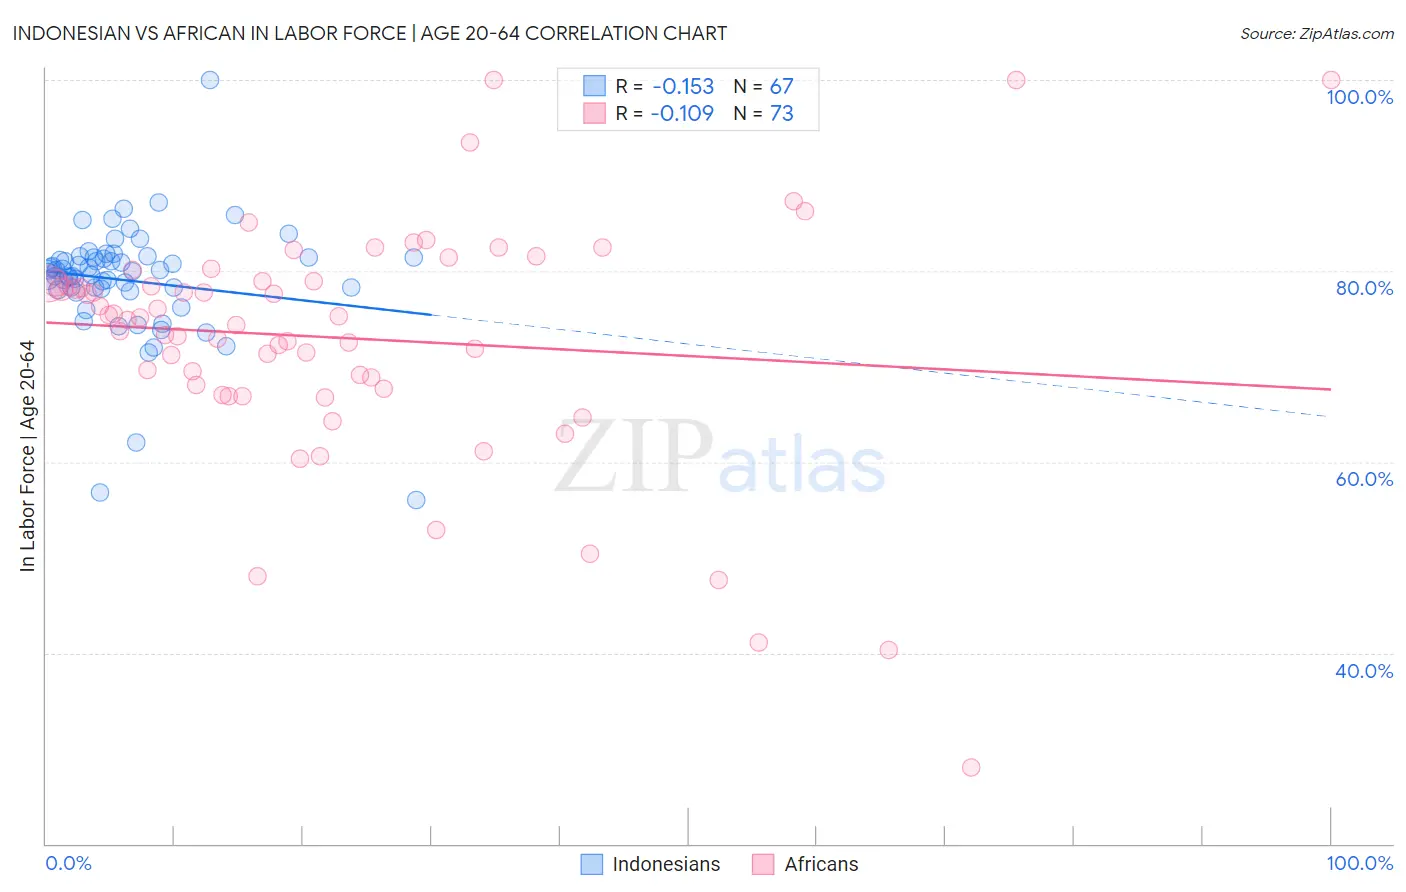
Indonesian vs African In Labor Force | Age 20-64 Correlation Chart
The statistical analysis conducted on geographies consisting of 162,740,324 people shows a poor negative correlation between the proportion of Indonesians and labor force participation rate among population between the ages 20 and 64 in the United States with a correlation coefficient (R) of -0.153 and weighted average of 79.4%. Similarly, the statistical analysis conducted on geographies consisting of 470,088,010 people shows a poor negative correlation between the proportion of Africans and labor force participation rate among population between the ages 20 and 64 in the United States with a correlation coefficient (R) of -0.109 and weighted average of 77.9%, a difference of 1.9%.
In Labor Force | Age 20-64 Correlation Summary
| Measurement | Indonesian | African |
| Minimum | 56.0% | 28.0% |
| Maximum | 100.0% | 100.0% |
| Range | 44.0% | 72.0% |
| Mean | 79.0% | 73.0% |
| Median | 80.0% | 75.1% |
| Interquartile 25% (IQ1) | 78.1% | 67.9% |
| Interquartile 75% (IQ3) | 81.4% | 79.0% |
| Interquartile Range (IQR) | 3.3% | 11.1% |
| Standard Deviation (Sample) | 6.2% | 12.7% |
| Standard Deviation (Population) | 6.1% | 12.6% |
Similar Demographics by In Labor Force | Age 20-64
Demographics Similar to Indonesians by In Labor Force | Age 20-64
In terms of in labor force | age 20-64, the demographic groups most similar to Indonesians are Immigrants from Denmark (79.4%, a difference of 0.010%), Immigrants from Thailand (79.4%, a difference of 0.010%), Swiss (79.4%, a difference of 0.030%), Immigrants from Austria (79.4%, a difference of 0.030%), and Ecuadorian (79.4%, a difference of 0.030%).
| Demographics | Rating | Rank | In Labor Force | Age 20-64 |
| Northern Europeans | 34.5 /100 | #186 | Fair 79.5% |
| Assyrians/Chaldeans/Syriacs | 33.3 /100 | #187 | Fair 79.4% |
| Immigrants | Haiti | 32.1 /100 | #188 | Fair 79.4% |
| Immigrants | El Salvador | 30.9 /100 | #189 | Fair 79.4% |
| Immigrants | Syria | 30.8 /100 | #190 | Fair 79.4% |
| Swiss | 28.9 /100 | #191 | Fair 79.4% |
| Immigrants | Denmark | 26.9 /100 | #192 | Fair 79.4% |
| Indonesians | 26.1 /100 | #193 | Fair 79.4% |
| Immigrants | Thailand | 24.8 /100 | #194 | Fair 79.4% |
| Immigrants | Austria | 23.7 /100 | #195 | Fair 79.4% |
| Ecuadorians | 23.1 /100 | #196 | Fair 79.4% |
| Immigrants | Senegal | 22.5 /100 | #197 | Fair 79.4% |
| Immigrants | Laos | 21.5 /100 | #198 | Fair 79.4% |
| Dutch | 20.2 /100 | #199 | Fair 79.3% |
| Immigrants | Oceania | 19.1 /100 | #200 | Poor 79.3% |
Demographics Similar to Africans by In Labor Force | Age 20-64
In terms of in labor force | age 20-64, the demographic groups most similar to Africans are Hmong (77.9%, a difference of 0.010%), Immigrants from Bangladesh (77.9%, a difference of 0.010%), Spanish American (77.8%, a difference of 0.070%), Vietnamese (78.0%, a difference of 0.080%), and Immigrants from Belize (78.0%, a difference of 0.090%).
| Demographics | Rating | Rank | In Labor Force | Age 20-64 |
| Immigrants | St. Vincent and the Grenadines | 0.0 /100 | #282 | Tragic 78.1% |
| Immigrants | Nonimmigrants | 0.0 /100 | #283 | Tragic 78.1% |
| Immigrants | Guyana | 0.0 /100 | #284 | Tragic 78.1% |
| Osage | 0.0 /100 | #285 | Tragic 78.0% |
| Immigrants | Belize | 0.0 /100 | #286 | Tragic 78.0% |
| Vietnamese | 0.0 /100 | #287 | Tragic 78.0% |
| Hmong | 0.0 /100 | #288 | Tragic 77.9% |
| Africans | 0.0 /100 | #289 | Tragic 77.9% |
| Immigrants | Bangladesh | 0.0 /100 | #290 | Tragic 77.9% |
| Spanish Americans | 0.0 /100 | #291 | Tragic 77.8% |
| Immigrants | Azores | 0.0 /100 | #292 | Tragic 77.8% |
| Delaware | 0.0 /100 | #293 | Tragic 77.8% |
| Immigrants | Central America | 0.0 /100 | #294 | Tragic 77.7% |
| Immigrants | Grenada | 0.0 /100 | #295 | Tragic 77.7% |
| Immigrants | Dominican Republic | 0.0 /100 | #296 | Tragic 77.7% |