Immigrants from Zimbabwe vs Immigrants from Russia In Labor Force | Age 45-54
COMPARE
Immigrants from Zimbabwe
Immigrants from Russia
In Labor Force | Age 45-54
In Labor Force | Age 45-54 Comparison
Immigrants from Zimbabwe
Immigrants from Russia
83.4%
IN LABOR FORCE | AGE 45-54
96.3/ 100
METRIC RATING
83rd/ 347
METRIC RANK
83.2%
IN LABOR FORCE | AGE 45-54
90.1/ 100
METRIC RATING
120th/ 347
METRIC RANK
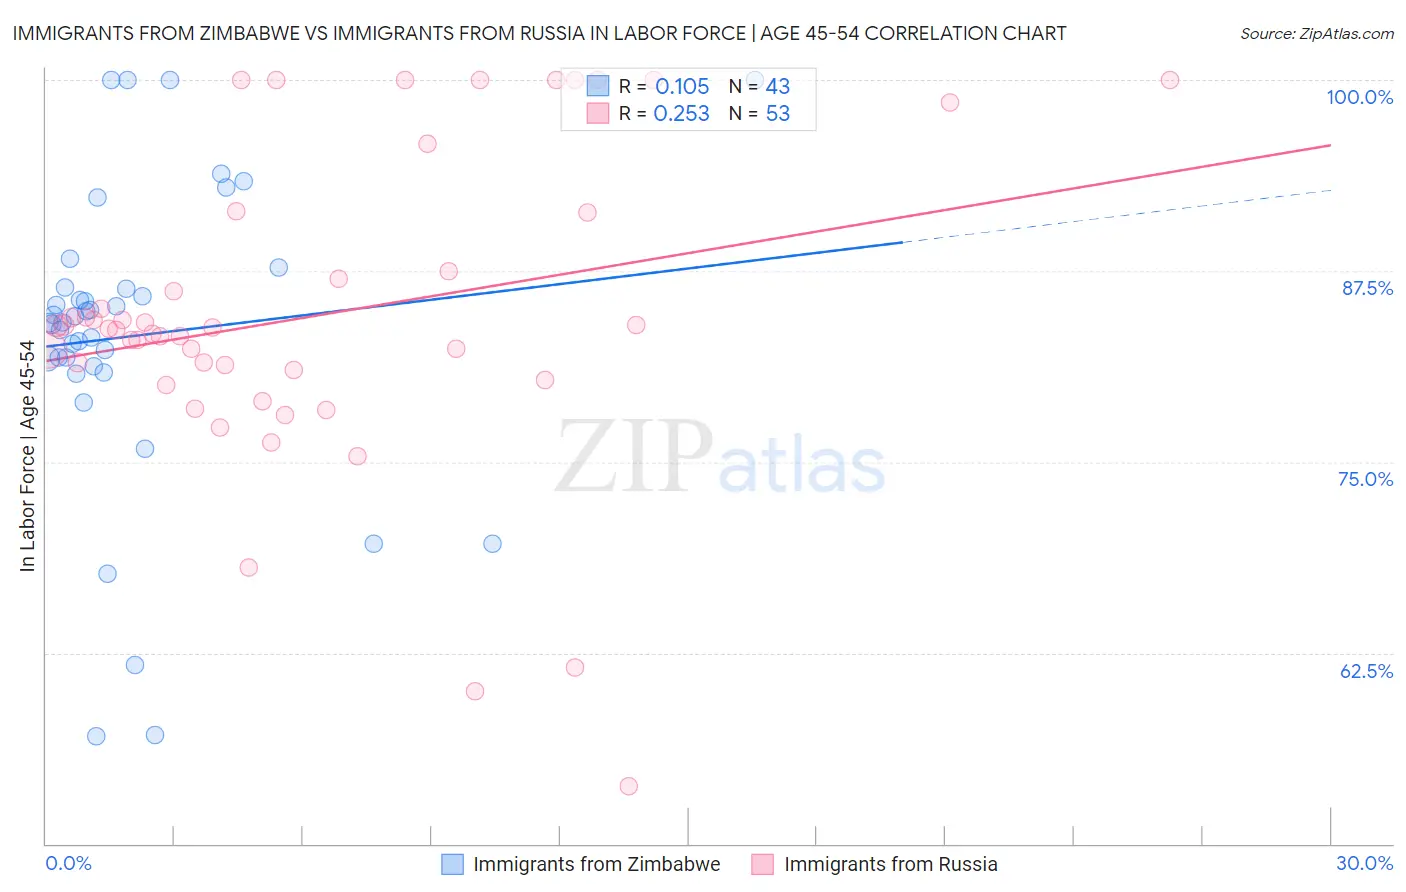
Immigrants from Zimbabwe vs Immigrants from Russia In Labor Force | Age 45-54 Correlation Chart
The statistical analysis conducted on geographies consisting of 117,788,320 people shows a poor positive correlation between the proportion of Immigrants from Zimbabwe and labor force participation rate among population between the ages 45 and 54 in the United States with a correlation coefficient (R) of 0.105 and weighted average of 83.4%. Similarly, the statistical analysis conducted on geographies consisting of 347,716,687 people shows a weak positive correlation between the proportion of Immigrants from Russia and labor force participation rate among population between the ages 45 and 54 in the United States with a correlation coefficient (R) of 0.253 and weighted average of 83.2%, a difference of 0.23%.
In Labor Force | Age 45-54 Correlation Summary
| Measurement | Immigrants from Zimbabwe | Immigrants from Russia |
| Minimum | 57.0% | 53.8% |
| Maximum | 100.0% | 100.0% |
| Range | 43.0% | 46.2% |
| Mean | 83.3% | 84.6% |
| Median | 84.1% | 83.7% |
| Interquartile 25% (IQ1) | 81.2% | 80.7% |
| Interquartile 75% (IQ3) | 86.4% | 89.4% |
| Interquartile Range (IQR) | 5.1% | 8.7% |
| Standard Deviation (Sample) | 10.0% | 10.2% |
| Standard Deviation (Population) | 9.8% | 10.1% |
Similar Demographics by In Labor Force | Age 45-54
Demographics Similar to Immigrants from Zimbabwe by In Labor Force | Age 45-54
In terms of in labor force | age 45-54, the demographic groups most similar to Immigrants from Zimbabwe are Immigrants from Eastern Asia (83.4%, a difference of 0.0%), Immigrants from Croatia (83.4%, a difference of 0.010%), Jordanian (83.4%, a difference of 0.010%), Immigrants from Bosnia and Herzegovina (83.3%, a difference of 0.010%), and Immigrants from Egypt (83.4%, a difference of 0.020%).
| Demographics | Rating | Rank | In Labor Force | Age 45-54 |
| Russians | 96.8 /100 | #76 | Exceptional 83.4% |
| Cubans | 96.7 /100 | #77 | Exceptional 83.4% |
| Immigrants | Egypt | 96.6 /100 | #78 | Exceptional 83.4% |
| Belgians | 96.5 /100 | #79 | Exceptional 83.4% |
| Immigrants | Croatia | 96.5 /100 | #80 | Exceptional 83.4% |
| Jordanians | 96.4 /100 | #81 | Exceptional 83.4% |
| Immigrants | Eastern Asia | 96.3 /100 | #82 | Exceptional 83.4% |
| Immigrants | Zimbabwe | 96.3 /100 | #83 | Exceptional 83.4% |
| Immigrants | Bosnia and Herzegovina | 96.0 /100 | #84 | Exceptional 83.3% |
| Greeks | 95.9 /100 | #85 | Exceptional 83.3% |
| Immigrants | Northern Africa | 95.7 /100 | #86 | Exceptional 83.3% |
| Immigrants | Eastern Europe | 95.6 /100 | #87 | Exceptional 83.3% |
| Immigrants | Asia | 95.6 /100 | #88 | Exceptional 83.3% |
| Indians (Asian) | 95.5 /100 | #89 | Exceptional 83.3% |
| Immigrants | Japan | 95.5 /100 | #90 | Exceptional 83.3% |
Demographics Similar to Immigrants from Russia by In Labor Force | Age 45-54
In terms of in labor force | age 45-54, the demographic groups most similar to Immigrants from Russia are Immigrants from Uruguay (83.2%, a difference of 0.0%), Immigrants from Europe (83.2%, a difference of 0.010%), Immigrants from China (83.2%, a difference of 0.020%), Uruguayan (83.1%, a difference of 0.020%), and Immigrants from Vietnam (83.1%, a difference of 0.030%).
| Demographics | Rating | Rank | In Labor Force | Age 45-54 |
| Immigrants | Albania | 91.8 /100 | #113 | Exceptional 83.2% |
| Assyrians/Chaldeans/Syriacs | 91.7 /100 | #114 | Exceptional 83.2% |
| Immigrants | Chile | 91.6 /100 | #115 | Exceptional 83.2% |
| Immigrants | Malaysia | 91.4 /100 | #116 | Exceptional 83.2% |
| Immigrants | China | 90.9 /100 | #117 | Exceptional 83.2% |
| Immigrants | Europe | 90.7 /100 | #118 | Exceptional 83.2% |
| Immigrants | Uruguay | 90.2 /100 | #119 | Exceptional 83.2% |
| Immigrants | Russia | 90.1 /100 | #120 | Exceptional 83.2% |
| Uruguayans | 89.4 /100 | #121 | Excellent 83.1% |
| Immigrants | Vietnam | 88.9 /100 | #122 | Excellent 83.1% |
| Tongans | 88.2 /100 | #123 | Excellent 83.1% |
| Bermudans | 88.0 /100 | #124 | Excellent 83.1% |
| Immigrants | Iran | 87.2 /100 | #125 | Excellent 83.1% |
| Immigrants | Belgium | 86.4 /100 | #126 | Excellent 83.1% |
| Immigrants | Jordan | 85.2 /100 | #127 | Excellent 83.1% |