Immigrants from Yemen vs Croatian In Labor Force | Age 20-64
COMPARE
Immigrants from Yemen
Croatian
In Labor Force | Age 20-64
In Labor Force | Age 20-64 Comparison
Immigrants from Yemen
Croatians
72.3%
IN LABOR FORCE | AGE 20-64
0.0/ 100
METRIC RATING
341st/ 347
METRIC RANK
80.1%
IN LABOR FORCE | AGE 20-64
97.1/ 100
METRIC RATING
87th/ 347
METRIC RANK
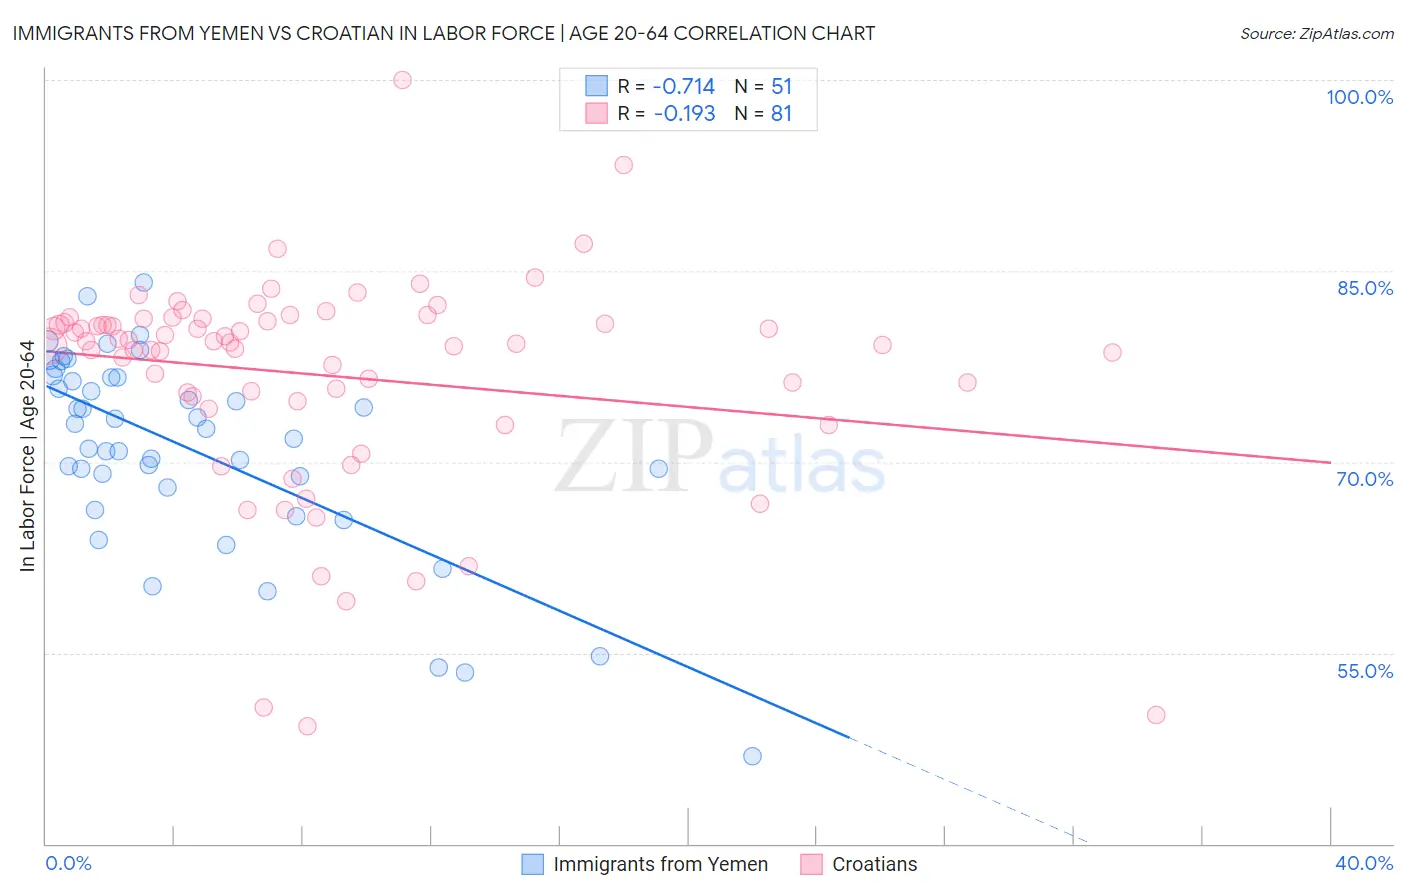
Immigrants from Yemen vs Croatian In Labor Force | Age 20-64 Correlation Chart
The statistical analysis conducted on geographies consisting of 82,433,611 people shows a strong negative correlation between the proportion of Immigrants from Yemen and labor force participation rate among population between the ages 20 and 64 in the United States with a correlation coefficient (R) of -0.714 and weighted average of 72.3%. Similarly, the statistical analysis conducted on geographies consisting of 375,744,392 people shows a poor negative correlation between the proportion of Croatians and labor force participation rate among population between the ages 20 and 64 in the United States with a correlation coefficient (R) of -0.193 and weighted average of 80.1%, a difference of 10.8%.
In Labor Force | Age 20-64 Correlation Summary
| Measurement | Immigrants from Yemen | Croatian |
| Minimum | 46.9% | 49.3% |
| Maximum | 84.1% | 100.0% |
| Range | 37.2% | 50.7% |
| Mean | 71.0% | 76.8% |
| Median | 72.6% | 79.4% |
| Interquartile 25% (IQ1) | 68.0% | 75.0% |
| Interquartile 75% (IQ3) | 76.6% | 81.1% |
| Interquartile Range (IQR) | 8.6% | 6.2% |
| Standard Deviation (Sample) | 7.9% | 8.5% |
| Standard Deviation (Population) | 7.8% | 8.5% |
Similar Demographics by In Labor Force | Age 20-64
Demographics Similar to Immigrants from Yemen by In Labor Force | Age 20-64
In terms of in labor force | age 20-64, the demographic groups most similar to Immigrants from Yemen are Pueblo (72.6%, a difference of 0.48%), Houma (72.7%, a difference of 0.64%), Yuman (71.7%, a difference of 0.78%), Hopi (71.7%, a difference of 0.80%), and Puerto Rican (73.1%, a difference of 1.1%).
| Demographics | Rating | Rank | In Labor Force | Age 20-64 |
| Natives/Alaskans | 0.0 /100 | #333 | Tragic 73.9% |
| Apache | 0.0 /100 | #334 | Tragic 73.7% |
| Ute | 0.0 /100 | #335 | Tragic 73.7% |
| Crow | 0.0 /100 | #336 | Tragic 73.3% |
| Yup'ik | 0.0 /100 | #337 | Tragic 73.2% |
| Puerto Ricans | 0.0 /100 | #338 | Tragic 73.1% |
| Houma | 0.0 /100 | #339 | Tragic 72.7% |
| Pueblo | 0.0 /100 | #340 | Tragic 72.6% |
| Immigrants | Yemen | 0.0 /100 | #341 | Tragic 72.3% |
| Yuman | 0.0 /100 | #342 | Tragic 71.7% |
| Hopi | 0.0 /100 | #343 | Tragic 71.7% |
| Lumbee | 0.0 /100 | #344 | Tragic 70.6% |
| Tohono O'odham | 0.0 /100 | #345 | Tragic 70.4% |
| Navajo | 0.0 /100 | #346 | Tragic 69.2% |
| Pima | 0.0 /100 | #347 | Tragic 69.0% |
Demographics Similar to Croatians by In Labor Force | Age 20-64
In terms of in labor force | age 20-64, the demographic groups most similar to Croatians are Jordanian (80.1%, a difference of 0.0%), Immigrants from Egypt (80.1%, a difference of 0.0%), Immigrants from Japan (80.1%, a difference of 0.010%), Colombian (80.1%, a difference of 0.010%), and Immigrants from Latvia (80.1%, a difference of 0.010%).
| Demographics | Rating | Rank | In Labor Force | Age 20-64 |
| Immigrants | Croatia | 97.6 /100 | #80 | Exceptional 80.1% |
| German Russians | 97.3 /100 | #81 | Exceptional 80.1% |
| Immigrants | Japan | 97.3 /100 | #82 | Exceptional 80.1% |
| Colombians | 97.3 /100 | #83 | Exceptional 80.1% |
| Immigrants | Latvia | 97.2 /100 | #84 | Exceptional 80.1% |
| Jordanians | 97.2 /100 | #85 | Exceptional 80.1% |
| Immigrants | Egypt | 97.1 /100 | #86 | Exceptional 80.1% |
| Croatians | 97.1 /100 | #87 | Exceptional 80.1% |
| Chileans | 97.0 /100 | #88 | Exceptional 80.1% |
| Immigrants | Venezuela | 96.8 /100 | #89 | Exceptional 80.1% |
| Poles | 96.8 /100 | #90 | Exceptional 80.1% |
| Uruguayans | 96.7 /100 | #91 | Exceptional 80.1% |
| Ghanaians | 96.7 /100 | #92 | Exceptional 80.1% |
| Immigrants | Belarus | 96.4 /100 | #93 | Exceptional 80.1% |
| Immigrants | Asia | 96.0 /100 | #94 | Exceptional 80.1% |