Immigrants from Western Europe vs Macedonian In Labor Force | Age 35-44
COMPARE
Immigrants from Western Europe
Macedonian
In Labor Force | Age 35-44
In Labor Force | Age 35-44 Comparison
Immigrants from Western Europe
Macedonians
84.2%
IN LABOR FORCE | AGE 35-44
24.7/ 100
METRIC RATING
197th/ 347
METRIC RANK
85.2%
IN LABOR FORCE | AGE 35-44
99.8/ 100
METRIC RATING
42nd/ 347
METRIC RANK
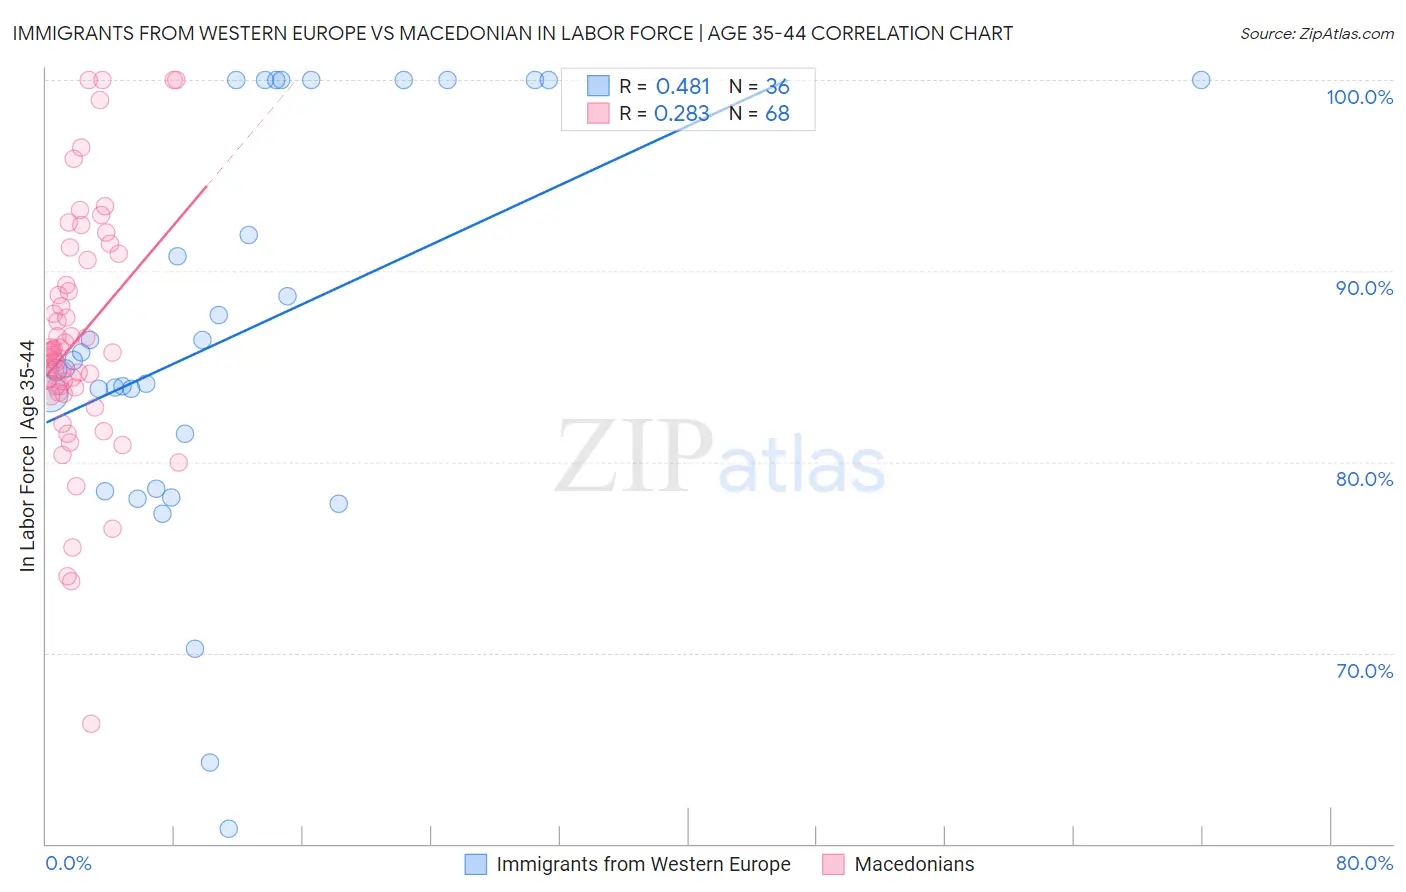
Immigrants from Western Europe vs Macedonian In Labor Force | Age 35-44 Correlation Chart
The statistical analysis conducted on geographies consisting of 493,820,556 people shows a moderate positive correlation between the proportion of Immigrants from Western Europe and labor force participation rate among population between the ages 35 and 44 in the United States with a correlation coefficient (R) of 0.481 and weighted average of 84.2%. Similarly, the statistical analysis conducted on geographies consisting of 132,628,531 people shows a weak positive correlation between the proportion of Macedonians and labor force participation rate among population between the ages 35 and 44 in the United States with a correlation coefficient (R) of 0.283 and weighted average of 85.2%, a difference of 1.2%.
In Labor Force | Age 35-44 Correlation Summary
| Measurement | Immigrants from Western Europe | Macedonian |
| Minimum | 60.8% | 66.3% |
| Maximum | 100.0% | 100.0% |
| Range | 39.2% | 33.7% |
| Mean | 86.7% | 86.4% |
| Median | 85.1% | 85.7% |
| Interquartile 25% (IQ1) | 80.1% | 83.8% |
| Interquartile 75% (IQ3) | 100.0% | 89.9% |
| Interquartile Range (IQR) | 19.9% | 6.2% |
| Standard Deviation (Sample) | 10.4% | 6.4% |
| Standard Deviation (Population) | 10.3% | 6.3% |
Similar Demographics by In Labor Force | Age 35-44
Demographics Similar to Immigrants from Western Europe by In Labor Force | Age 35-44
In terms of in labor force | age 35-44, the demographic groups most similar to Immigrants from Western Europe are Immigrants from England (84.2%, a difference of 0.0%), Immigrants from Indonesia (84.2%, a difference of 0.010%), Immigrants from Caribbean (84.2%, a difference of 0.010%), Ecuadorian (84.2%, a difference of 0.010%), and Syrian (84.2%, a difference of 0.010%).
| Demographics | Rating | Rank | In Labor Force | Age 35-44 |
| Portuguese | 31.9 /100 | #190 | Fair 84.3% |
| Immigrants | Philippines | 27.9 /100 | #191 | Fair 84.2% |
| Immigrants | Vietnam | 27.4 /100 | #192 | Fair 84.2% |
| Hungarians | 26.8 /100 | #193 | Fair 84.2% |
| Immigrants | Indonesia | 25.7 /100 | #194 | Fair 84.2% |
| Immigrants | Caribbean | 25.7 /100 | #195 | Fair 84.2% |
| Immigrants | England | 25.0 /100 | #196 | Fair 84.2% |
| Immigrants | Western Europe | 24.7 /100 | #197 | Fair 84.2% |
| Ecuadorians | 24.0 /100 | #198 | Fair 84.2% |
| Syrians | 23.2 /100 | #199 | Fair 84.2% |
| Moroccans | 23.2 /100 | #200 | Fair 84.2% |
| British | 23.0 /100 | #201 | Fair 84.2% |
| Immigrants | Uzbekistan | 22.8 /100 | #202 | Fair 84.2% |
| Immigrants | South Eastern Asia | 22.4 /100 | #203 | Fair 84.2% |
| Canadians | 19.9 /100 | #204 | Poor 84.2% |
Demographics Similar to Macedonians by In Labor Force | Age 35-44
In terms of in labor force | age 35-44, the demographic groups most similar to Macedonians are Immigrants from Bulgaria (85.2%, a difference of 0.0%), Immigrants from Zimbabwe (85.2%, a difference of 0.0%), Immigrants from Poland (85.2%, a difference of 0.010%), Eastern European (85.2%, a difference of 0.010%), and Polish (85.2%, a difference of 0.010%).
| Demographics | Rating | Rank | In Labor Force | Age 35-44 |
| Estonians | 99.9 /100 | #35 | Exceptional 85.3% |
| Immigrants | Morocco | 99.8 /100 | #36 | Exceptional 85.2% |
| Kenyans | 99.8 /100 | #37 | Exceptional 85.2% |
| Immigrants | Poland | 99.8 /100 | #38 | Exceptional 85.2% |
| Eastern Europeans | 99.8 /100 | #39 | Exceptional 85.2% |
| Immigrants | Bulgaria | 99.8 /100 | #40 | Exceptional 85.2% |
| Immigrants | Zimbabwe | 99.8 /100 | #41 | Exceptional 85.2% |
| Macedonians | 99.8 /100 | #42 | Exceptional 85.2% |
| Poles | 99.8 /100 | #43 | Exceptional 85.2% |
| Lithuanians | 99.8 /100 | #44 | Exceptional 85.2% |
| Cypriots | 99.8 /100 | #45 | Exceptional 85.2% |
| Immigrants | Hong Kong | 99.8 /100 | #46 | Exceptional 85.2% |
| German Russians | 99.8 /100 | #47 | Exceptional 85.2% |
| Immigrants | Eritrea | 99.7 /100 | #48 | Exceptional 85.2% |
| Croatians | 99.7 /100 | #49 | Exceptional 85.2% |