Immigrants from China vs Slovene In Labor Force | Age 30-34
COMPARE
Immigrants from China
Slovene
In Labor Force | Age 30-34
In Labor Force | Age 30-34 Comparison
Immigrants from China
Slovenes
85.4%
IN LABOR FORCE | AGE 30-34
99.0/ 100
METRIC RATING
72nd/ 347
METRIC RANK
85.6%
IN LABOR FORCE | AGE 30-34
99.7/ 100
METRIC RATING
52nd/ 347
METRIC RANK
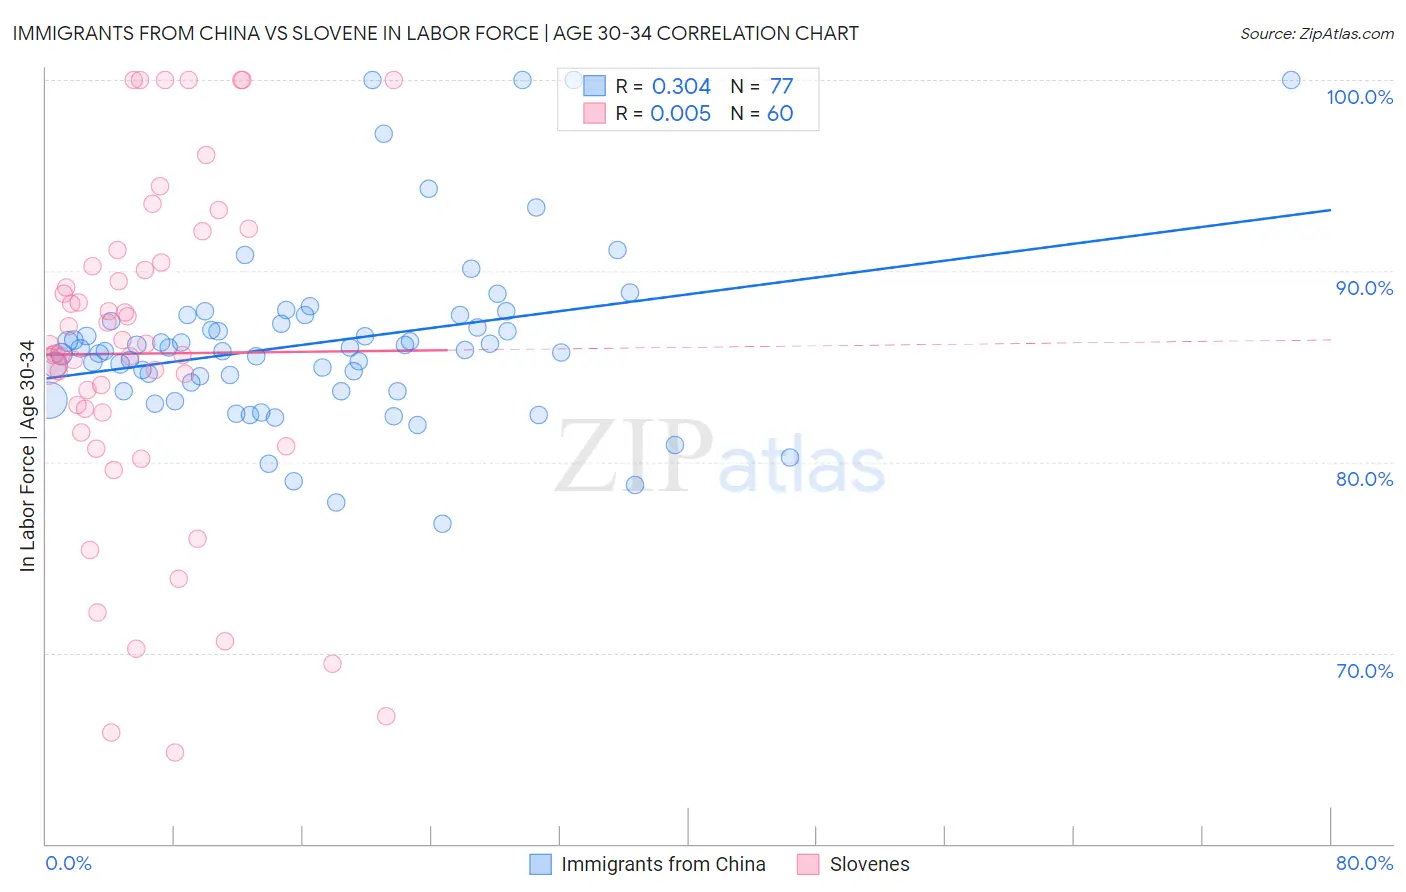
Immigrants from China vs Slovene In Labor Force | Age 30-34 Correlation Chart
The statistical analysis conducted on geographies consisting of 456,657,709 people shows a mild positive correlation between the proportion of Immigrants from China and labor force participation rate among population between the ages 30 and 34 in the United States with a correlation coefficient (R) of 0.304 and weighted average of 85.4%. Similarly, the statistical analysis conducted on geographies consisting of 261,230,340 people shows no correlation between the proportion of Slovenes and labor force participation rate among population between the ages 30 and 34 in the United States with a correlation coefficient (R) of 0.005 and weighted average of 85.6%, a difference of 0.22%.
In Labor Force | Age 30-34 Correlation Summary
| Measurement | Immigrants from China | Slovene |
| Minimum | 76.8% | 64.8% |
| Maximum | 100.0% | 100.0% |
| Range | 23.2% | 35.2% |
| Mean | 86.3% | 85.7% |
| Median | 85.8% | 85.9% |
| Interquartile 25% (IQ1) | 83.7% | 82.1% |
| Interquartile 75% (IQ3) | 87.5% | 90.4% |
| Interquartile Range (IQR) | 3.8% | 8.3% |
| Standard Deviation (Sample) | 4.6% | 8.8% |
| Standard Deviation (Population) | 4.6% | 8.8% |
Demographics Similar to Immigrants from China and Slovenes by In Labor Force | Age 30-34
In terms of in labor force | age 30-34, the demographic groups most similar to Immigrants from China are Immigrants from Japan (85.4%, a difference of 0.0%), Brazilian (85.4%, a difference of 0.010%), Immigrants from Iran (85.4%, a difference of 0.030%), Immigrants from Eastern Europe (85.4%, a difference of 0.060%), and Ghanaian (85.4%, a difference of 0.070%). Similarly, the demographic groups most similar to Slovenes are Filipino (85.5%, a difference of 0.050%), Immigrants from Kenya (85.5%, a difference of 0.060%), Immigrants from Turkey (85.5%, a difference of 0.060%), Czech (85.5%, a difference of 0.070%), and Russian (85.5%, a difference of 0.070%).
| Demographics | Rating | Rank | In Labor Force | Age 30-34 |
| Slovenes | 99.7 /100 | #52 | Exceptional 85.6% |
| Filipinos | 99.6 /100 | #53 | Exceptional 85.5% |
| Immigrants | Kenya | 99.6 /100 | #54 | Exceptional 85.5% |
| Immigrants | Turkey | 99.6 /100 | #55 | Exceptional 85.5% |
| Czechs | 99.6 /100 | #56 | Exceptional 85.5% |
| Russians | 99.6 /100 | #57 | Exceptional 85.5% |
| Poles | 99.6 /100 | #58 | Exceptional 85.5% |
| Immigrants | Poland | 99.5 /100 | #59 | Exceptional 85.5% |
| Immigrants | France | 99.5 /100 | #60 | Exceptional 85.5% |
| Immigrants | Brazil | 99.5 /100 | #61 | Exceptional 85.5% |
| Soviet Union | 99.4 /100 | #62 | Exceptional 85.5% |
| Macedonians | 99.4 /100 | #63 | Exceptional 85.5% |
| Italians | 99.4 /100 | #64 | Exceptional 85.4% |
| Senegalese | 99.4 /100 | #65 | Exceptional 85.4% |
| Ghanaians | 99.4 /100 | #66 | Exceptional 85.4% |
| Kenyans | 99.3 /100 | #67 | Exceptional 85.4% |
| Immigrants | Eastern Europe | 99.3 /100 | #68 | Exceptional 85.4% |
| Immigrants | Iran | 99.2 /100 | #69 | Exceptional 85.4% |
| Brazilians | 99.1 /100 | #70 | Exceptional 85.4% |
| Immigrants | Japan | 99.1 /100 | #71 | Exceptional 85.4% |
| Immigrants | China | 99.0 /100 | #72 | Exceptional 85.4% |