Immigrants from Guyana vs Immigrants from Costa Rica In Labor Force | Age 30-34
COMPARE
Immigrants from Guyana
Immigrants from Costa Rica
In Labor Force | Age 30-34
In Labor Force | Age 30-34 Comparison
Immigrants from Guyana
Immigrants from Costa Rica
83.8%
IN LABOR FORCE | AGE 30-34
0.2/ 100
METRIC RATING
263rd/ 347
METRIC RANK
84.5%
IN LABOR FORCE | AGE 30-34
23.9/ 100
METRIC RATING
193rd/ 347
METRIC RANK
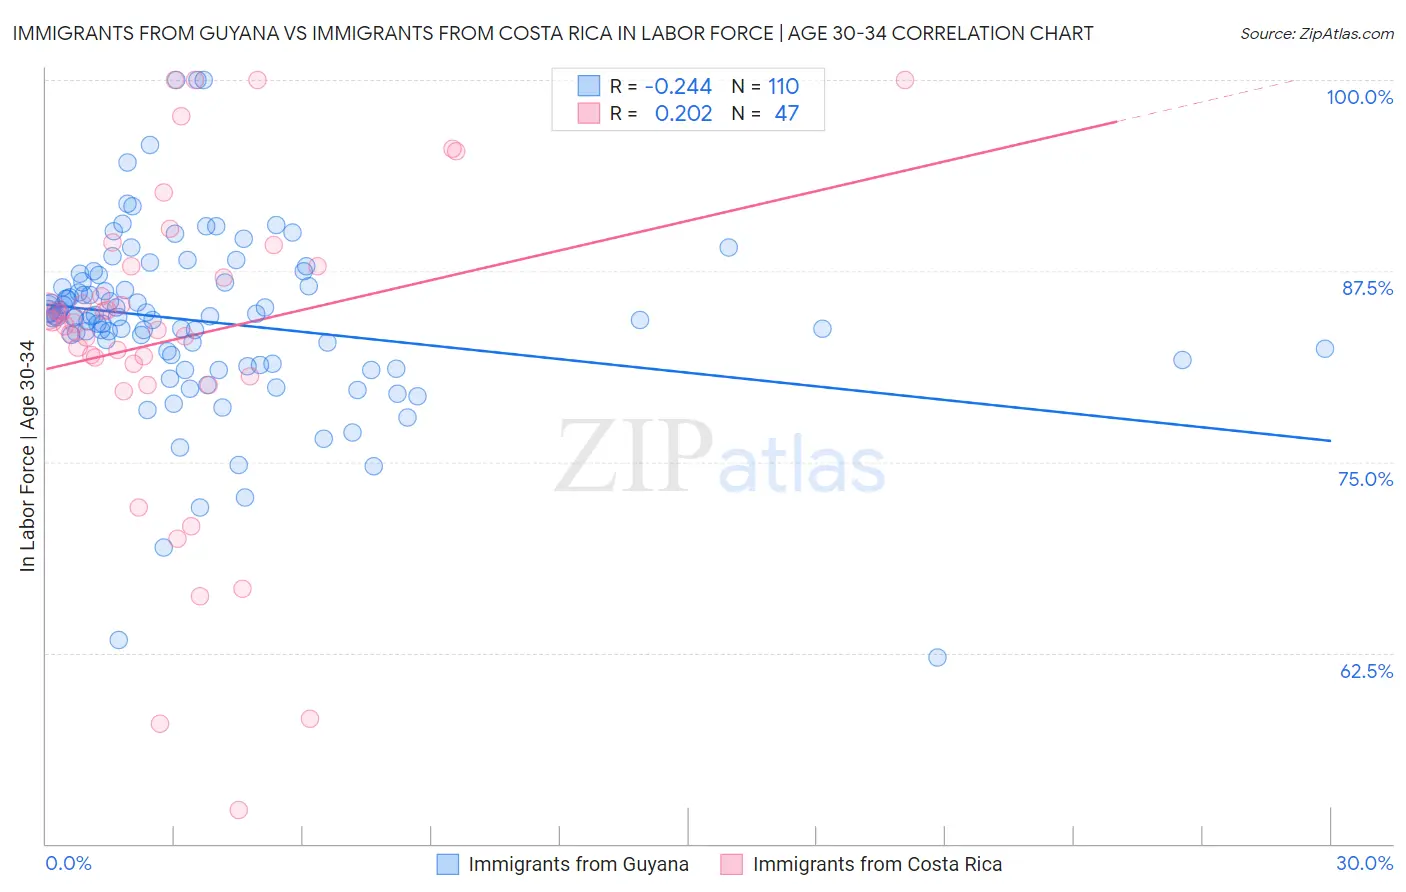
Immigrants from Guyana vs Immigrants from Costa Rica In Labor Force | Age 30-34 Correlation Chart
The statistical analysis conducted on geographies consisting of 183,640,015 people shows a weak negative correlation between the proportion of Immigrants from Guyana and labor force participation rate among population between the ages 30 and 34 in the United States with a correlation coefficient (R) of -0.244 and weighted average of 83.8%. Similarly, the statistical analysis conducted on geographies consisting of 204,236,766 people shows a weak positive correlation between the proportion of Immigrants from Costa Rica and labor force participation rate among population between the ages 30 and 34 in the United States with a correlation coefficient (R) of 0.202 and weighted average of 84.5%, a difference of 0.88%.
In Labor Force | Age 30-34 Correlation Summary
| Measurement | Immigrants from Guyana | Immigrants from Costa Rica |
| Minimum | 62.2% | 52.2% |
| Maximum | 100.0% | 100.0% |
| Range | 37.8% | 47.8% |
| Mean | 84.1% | 83.1% |
| Median | 84.5% | 84.1% |
| Interquartile 25% (IQ1) | 81.4% | 80.6% |
| Interquartile 75% (IQ3) | 86.8% | 87.8% |
| Interquartile Range (IQR) | 5.4% | 7.2% |
| Standard Deviation (Sample) | 5.9% | 10.7% |
| Standard Deviation (Population) | 5.8% | 10.5% |
Similar Demographics by In Labor Force | Age 30-34
Demographics Similar to Immigrants from Guyana by In Labor Force | Age 30-34
In terms of in labor force | age 30-34, the demographic groups most similar to Immigrants from Guyana are Dominican (83.8%, a difference of 0.0%), Guyanese (83.8%, a difference of 0.020%), Immigrants from Dominican Republic (83.8%, a difference of 0.030%), Honduran (83.8%, a difference of 0.050%), and Scotch-Irish (83.8%, a difference of 0.050%).
| Demographics | Rating | Rank | In Labor Force | Age 30-34 |
| Immigrants | Lebanon | 0.4 /100 | #256 | Tragic 83.9% |
| Iraqis | 0.3 /100 | #257 | Tragic 83.8% |
| Hondurans | 0.3 /100 | #258 | Tragic 83.8% |
| Scotch-Irish | 0.3 /100 | #259 | Tragic 83.8% |
| Immigrants | Dominican Republic | 0.3 /100 | #260 | Tragic 83.8% |
| Guyanese | 0.3 /100 | #261 | Tragic 83.8% |
| Dominicans | 0.2 /100 | #262 | Tragic 83.8% |
| Immigrants | Guyana | 0.2 /100 | #263 | Tragic 83.8% |
| Guatemalans | 0.2 /100 | #264 | Tragic 83.7% |
| Immigrants | Honduras | 0.1 /100 | #265 | Tragic 83.7% |
| Immigrants | Guatemala | 0.1 /100 | #266 | Tragic 83.7% |
| Spaniards | 0.1 /100 | #267 | Tragic 83.6% |
| Immigrants | Bangladesh | 0.1 /100 | #268 | Tragic 83.6% |
| Vietnamese | 0.1 /100 | #269 | Tragic 83.6% |
| Spanish Americans | 0.0 /100 | #270 | Tragic 83.5% |
Demographics Similar to Immigrants from Costa Rica by In Labor Force | Age 30-34
In terms of in labor force | age 30-34, the demographic groups most similar to Immigrants from Costa Rica are Immigrants from Afghanistan (84.5%, a difference of 0.0%), Hungarian (84.5%, a difference of 0.010%), Scandinavian (84.5%, a difference of 0.010%), Korean (84.5%, a difference of 0.010%), and British (84.5%, a difference of 0.010%).
| Demographics | Rating | Rank | In Labor Force | Age 30-34 |
| Immigrants | Congo | 29.7 /100 | #186 | Fair 84.6% |
| Costa Ricans | 29.6 /100 | #187 | Fair 84.6% |
| Taiwanese | 29.4 /100 | #188 | Fair 84.6% |
| Nigerians | 28.9 /100 | #189 | Fair 84.5% |
| Immigrants | Zaire | 25.8 /100 | #190 | Fair 84.5% |
| Hungarians | 24.8 /100 | #191 | Fair 84.5% |
| Scandinavians | 24.7 /100 | #192 | Fair 84.5% |
| Immigrants | Costa Rica | 23.9 /100 | #193 | Fair 84.5% |
| Immigrants | Afghanistan | 23.5 /100 | #194 | Fair 84.5% |
| Koreans | 23.2 /100 | #195 | Fair 84.5% |
| British | 22.9 /100 | #196 | Fair 84.5% |
| Immigrants | Syria | 21.9 /100 | #197 | Fair 84.5% |
| Dutch | 20.2 /100 | #198 | Fair 84.5% |
| Immigrants | Thailand | 19.1 /100 | #199 | Poor 84.5% |
| Sub-Saharan Africans | 19.0 /100 | #200 | Poor 84.5% |