Immigrants from Vietnam vs Immigrants from Eritrea In Labor Force | Age 25-29
COMPARE
Immigrants from Vietnam
Immigrants from Eritrea
In Labor Force | Age 25-29
In Labor Force | Age 25-29 Comparison
Immigrants from Vietnam
Immigrants from Eritrea
84.7%
IN LABOR FORCE | AGE 25-29
50.5/ 100
METRIC RATING
171st/ 347
METRIC RANK
85.7%
IN LABOR FORCE | AGE 25-29
99.9/ 100
METRIC RATING
42nd/ 347
METRIC RANK
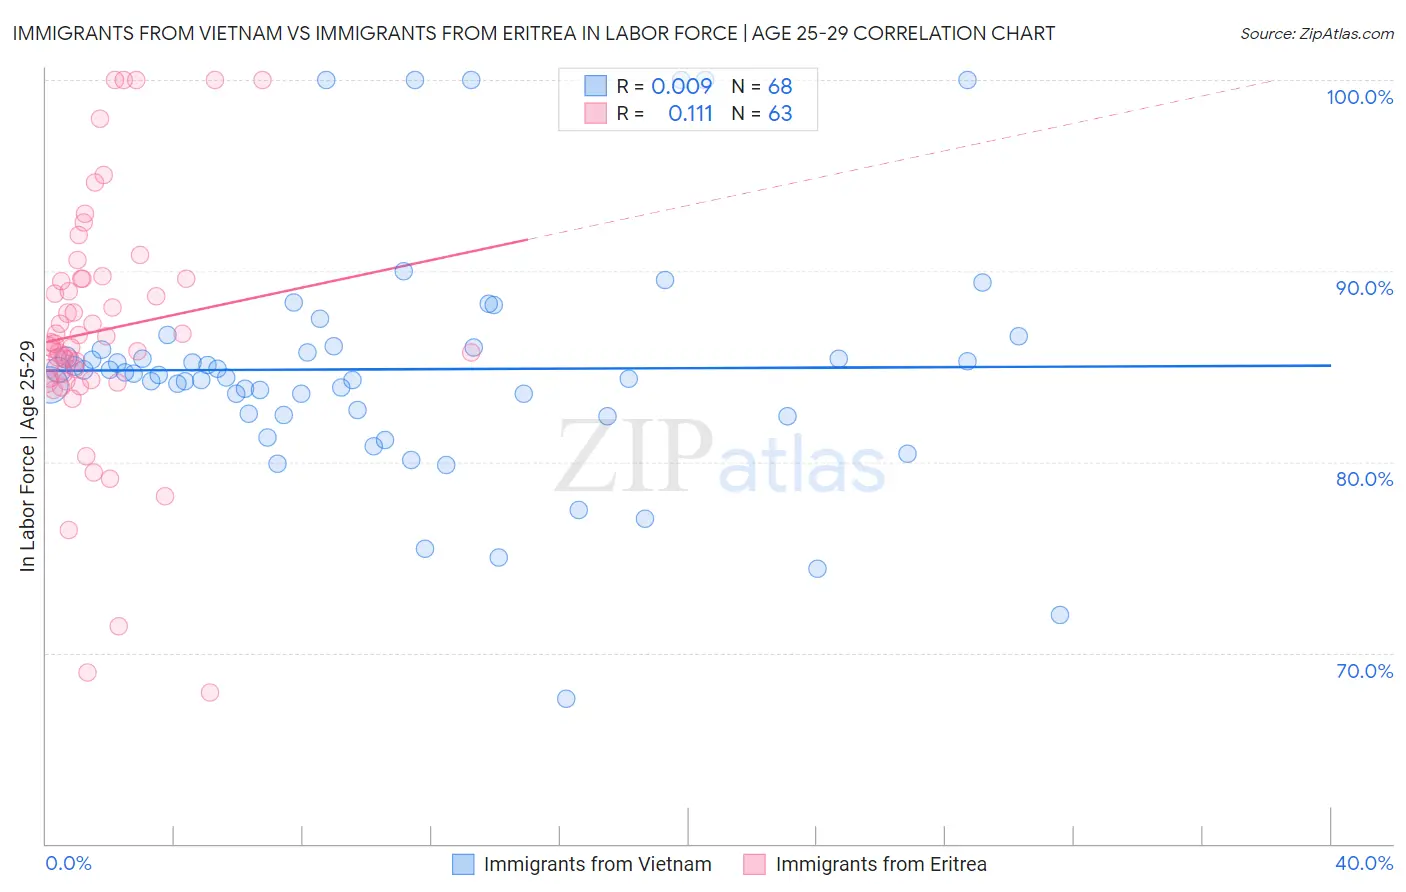
Immigrants from Vietnam vs Immigrants from Eritrea In Labor Force | Age 25-29 Correlation Chart
The statistical analysis conducted on geographies consisting of 404,726,104 people shows no correlation between the proportion of Immigrants from Vietnam and labor force participation rate among population between the ages 25 and 29 in the United States with a correlation coefficient (R) of 0.009 and weighted average of 84.7%. Similarly, the statistical analysis conducted on geographies consisting of 104,848,070 people shows a poor positive correlation between the proportion of Immigrants from Eritrea and labor force participation rate among population between the ages 25 and 29 in the United States with a correlation coefficient (R) of 0.111 and weighted average of 85.7%, a difference of 1.2%.
In Labor Force | Age 25-29 Correlation Summary
| Measurement | Immigrants from Vietnam | Immigrants from Eritrea |
| Minimum | 67.6% | 67.9% |
| Maximum | 100.0% | 100.0% |
| Range | 32.4% | 32.1% |
| Mean | 84.8% | 86.9% |
| Median | 84.6% | 86.2% |
| Interquartile 25% (IQ1) | 82.5% | 84.3% |
| Interquartile 75% (IQ3) | 85.9% | 89.6% |
| Interquartile Range (IQR) | 3.5% | 5.3% |
| Standard Deviation (Sample) | 6.2% | 6.5% |
| Standard Deviation (Population) | 6.1% | 6.5% |
Similar Demographics by In Labor Force | Age 25-29
Demographics Similar to Immigrants from Vietnam by In Labor Force | Age 25-29
In terms of in labor force | age 25-29, the demographic groups most similar to Immigrants from Vietnam are Immigrants from Western Europe (84.7%, a difference of 0.0%), Assyrian/Chaldean/Syriac (84.7%, a difference of 0.0%), Palestinian (84.7%, a difference of 0.0%), Celtic (84.7%, a difference of 0.010%), and Tongan (84.7%, a difference of 0.010%).
| Demographics | Rating | Rank | In Labor Force | Age 25-29 |
| Ghanaians | 57.6 /100 | #164 | Average 84.7% |
| Immigrants | Burma/Myanmar | 57.4 /100 | #165 | Average 84.7% |
| Immigrants | Spain | 56.9 /100 | #166 | Average 84.7% |
| Indonesians | 56.5 /100 | #167 | Average 84.7% |
| South Americans | 54.9 /100 | #168 | Average 84.7% |
| Celtics | 52.5 /100 | #169 | Average 84.7% |
| Tongans | 52.4 /100 | #170 | Average 84.7% |
| Immigrants | Vietnam | 50.5 /100 | #171 | Average 84.7% |
| Immigrants | Western Europe | 50.4 /100 | #172 | Average 84.7% |
| Assyrians/Chaldeans/Syriacs | 50.2 /100 | #173 | Average 84.7% |
| Palestinians | 50.0 /100 | #174 | Average 84.7% |
| Hungarians | 47.8 /100 | #175 | Average 84.6% |
| Malaysians | 46.8 /100 | #176 | Average 84.6% |
| Immigrants | China | 45.7 /100 | #177 | Average 84.6% |
| Immigrants | Thailand | 45.2 /100 | #178 | Average 84.6% |
Demographics Similar to Immigrants from Eritrea by In Labor Force | Age 25-29
In terms of in labor force | age 25-29, the demographic groups most similar to Immigrants from Eritrea are Immigrants from India (85.7%, a difference of 0.010%), Macedonian (85.7%, a difference of 0.020%), Immigrants from Sierra Leone (85.7%, a difference of 0.020%), Immigrants from Greece (85.7%, a difference of 0.040%), and Immigrants from Albania (85.7%, a difference of 0.050%).
| Demographics | Rating | Rank | In Labor Force | Age 25-29 |
| Cypriots | 99.9 /100 | #35 | Exceptional 85.8% |
| Immigrants | Nepal | 99.9 /100 | #36 | Exceptional 85.8% |
| Poles | 99.9 /100 | #37 | Exceptional 85.8% |
| Sierra Leoneans | 99.9 /100 | #38 | Exceptional 85.8% |
| Croatians | 99.9 /100 | #39 | Exceptional 85.8% |
| Immigrants | Albania | 99.9 /100 | #40 | Exceptional 85.7% |
| Immigrants | Greece | 99.9 /100 | #41 | Exceptional 85.7% |
| Immigrants | Eritrea | 99.9 /100 | #42 | Exceptional 85.7% |
| Immigrants | India | 99.9 /100 | #43 | Exceptional 85.7% |
| Macedonians | 99.9 /100 | #44 | Exceptional 85.7% |
| Immigrants | Sierra Leone | 99.9 /100 | #45 | Exceptional 85.7% |
| Czechs | 99.8 /100 | #46 | Exceptional 85.6% |
| Turks | 99.8 /100 | #47 | Exceptional 85.6% |
| Italians | 99.8 /100 | #48 | Exceptional 85.6% |
| Swedes | 99.8 /100 | #49 | Exceptional 85.6% |