Portuguese vs Immigrants from Eritrea In Labor Force | Age 25-29
COMPARE
Portuguese
Immigrants from Eritrea
In Labor Force | Age 25-29
In Labor Force | Age 25-29 Comparison
Portuguese
Immigrants from Eritrea
84.4%
IN LABOR FORCE | AGE 25-29
21.2/ 100
METRIC RATING
194th/ 347
METRIC RANK
85.7%
IN LABOR FORCE | AGE 25-29
99.9/ 100
METRIC RATING
42nd/ 347
METRIC RANK
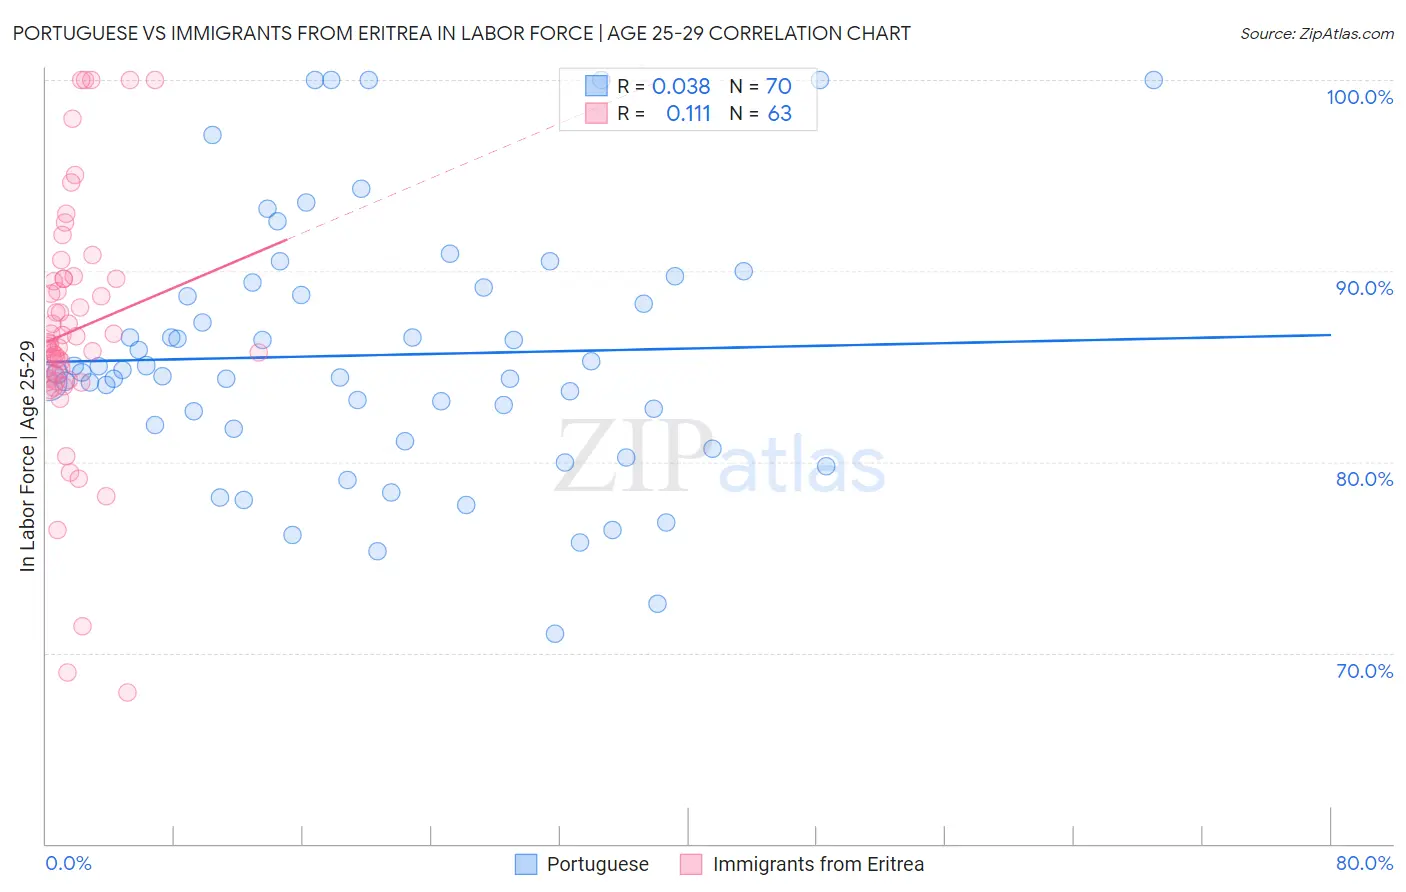
Portuguese vs Immigrants from Eritrea In Labor Force | Age 25-29 Correlation Chart
The statistical analysis conducted on geographies consisting of 450,025,288 people shows no correlation between the proportion of Portuguese and labor force participation rate among population between the ages 25 and 29 in the United States with a correlation coefficient (R) of 0.038 and weighted average of 84.4%. Similarly, the statistical analysis conducted on geographies consisting of 104,848,070 people shows a poor positive correlation between the proportion of Immigrants from Eritrea and labor force participation rate among population between the ages 25 and 29 in the United States with a correlation coefficient (R) of 0.111 and weighted average of 85.7%, a difference of 1.5%.
In Labor Force | Age 25-29 Correlation Summary
| Measurement | Portuguese | Immigrants from Eritrea |
| Minimum | 71.0% | 67.9% |
| Maximum | 100.0% | 100.0% |
| Range | 29.0% | 32.1% |
| Mean | 85.6% | 86.9% |
| Median | 84.7% | 86.2% |
| Interquartile 25% (IQ1) | 81.7% | 84.3% |
| Interquartile 75% (IQ3) | 89.1% | 89.6% |
| Interquartile Range (IQR) | 7.4% | 5.3% |
| Standard Deviation (Sample) | 6.7% | 6.5% |
| Standard Deviation (Population) | 6.7% | 6.5% |
Similar Demographics by In Labor Force | Age 25-29
Demographics Similar to Portuguese by In Labor Force | Age 25-29
In terms of in labor force | age 25-29, the demographic groups most similar to Portuguese are Immigrants from Israel (84.4%, a difference of 0.010%), Immigrants from South Eastern Asia (84.4%, a difference of 0.020%), Tlingit-Haida (84.4%, a difference of 0.020%), Immigrants from Iraq (84.4%, a difference of 0.030%), and Immigrants from Germany (84.4%, a difference of 0.030%).
| Demographics | Rating | Rank | In Labor Force | Age 25-29 |
| Immigrants | Portugal | 34.7 /100 | #187 | Fair 84.6% |
| Immigrants | Ukraine | 33.7 /100 | #188 | Fair 84.5% |
| Moroccans | 32.6 /100 | #189 | Fair 84.5% |
| Welsh | 31.1 /100 | #190 | Fair 84.5% |
| Zimbabweans | 28.7 /100 | #191 | Fair 84.5% |
| English | 25.8 /100 | #192 | Fair 84.5% |
| South American Indians | 25.0 /100 | #193 | Fair 84.5% |
| Portuguese | 21.2 /100 | #194 | Fair 84.4% |
| Immigrants | Israel | 20.8 /100 | #195 | Fair 84.4% |
| Immigrants | South Eastern Asia | 19.5 /100 | #196 | Poor 84.4% |
| Tlingit-Haida | 19.3 /100 | #197 | Poor 84.4% |
| Immigrants | Iraq | 19.0 /100 | #198 | Poor 84.4% |
| Immigrants | Germany | 18.3 /100 | #199 | Poor 84.4% |
| Immigrants | Kazakhstan | 17.5 /100 | #200 | Poor 84.4% |
| Laotians | 16.6 /100 | #201 | Poor 84.4% |
Demographics Similar to Immigrants from Eritrea by In Labor Force | Age 25-29
In terms of in labor force | age 25-29, the demographic groups most similar to Immigrants from Eritrea are Immigrants from India (85.7%, a difference of 0.010%), Macedonian (85.7%, a difference of 0.020%), Immigrants from Sierra Leone (85.7%, a difference of 0.020%), Immigrants from Greece (85.7%, a difference of 0.040%), and Immigrants from Albania (85.7%, a difference of 0.050%).
| Demographics | Rating | Rank | In Labor Force | Age 25-29 |
| Cypriots | 99.9 /100 | #35 | Exceptional 85.8% |
| Immigrants | Nepal | 99.9 /100 | #36 | Exceptional 85.8% |
| Poles | 99.9 /100 | #37 | Exceptional 85.8% |
| Sierra Leoneans | 99.9 /100 | #38 | Exceptional 85.8% |
| Croatians | 99.9 /100 | #39 | Exceptional 85.8% |
| Immigrants | Albania | 99.9 /100 | #40 | Exceptional 85.7% |
| Immigrants | Greece | 99.9 /100 | #41 | Exceptional 85.7% |
| Immigrants | Eritrea | 99.9 /100 | #42 | Exceptional 85.7% |
| Immigrants | India | 99.9 /100 | #43 | Exceptional 85.7% |
| Macedonians | 99.9 /100 | #44 | Exceptional 85.7% |
| Immigrants | Sierra Leone | 99.9 /100 | #45 | Exceptional 85.7% |
| Czechs | 99.8 /100 | #46 | Exceptional 85.6% |
| Turks | 99.8 /100 | #47 | Exceptional 85.6% |
| Italians | 99.8 /100 | #48 | Exceptional 85.6% |
| Swedes | 99.8 /100 | #49 | Exceptional 85.6% |