Immigrants from Vietnam vs Palestinian In Labor Force | Age 25-29
COMPARE
Immigrants from Vietnam
Palestinian
In Labor Force | Age 25-29
In Labor Force | Age 25-29 Comparison
Immigrants from Vietnam
Palestinians
84.7%
IN LABOR FORCE | AGE 25-29
50.5/ 100
METRIC RATING
171st/ 347
METRIC RANK
84.7%
IN LABOR FORCE | AGE 25-29
50.0/ 100
METRIC RATING
174th/ 347
METRIC RANK
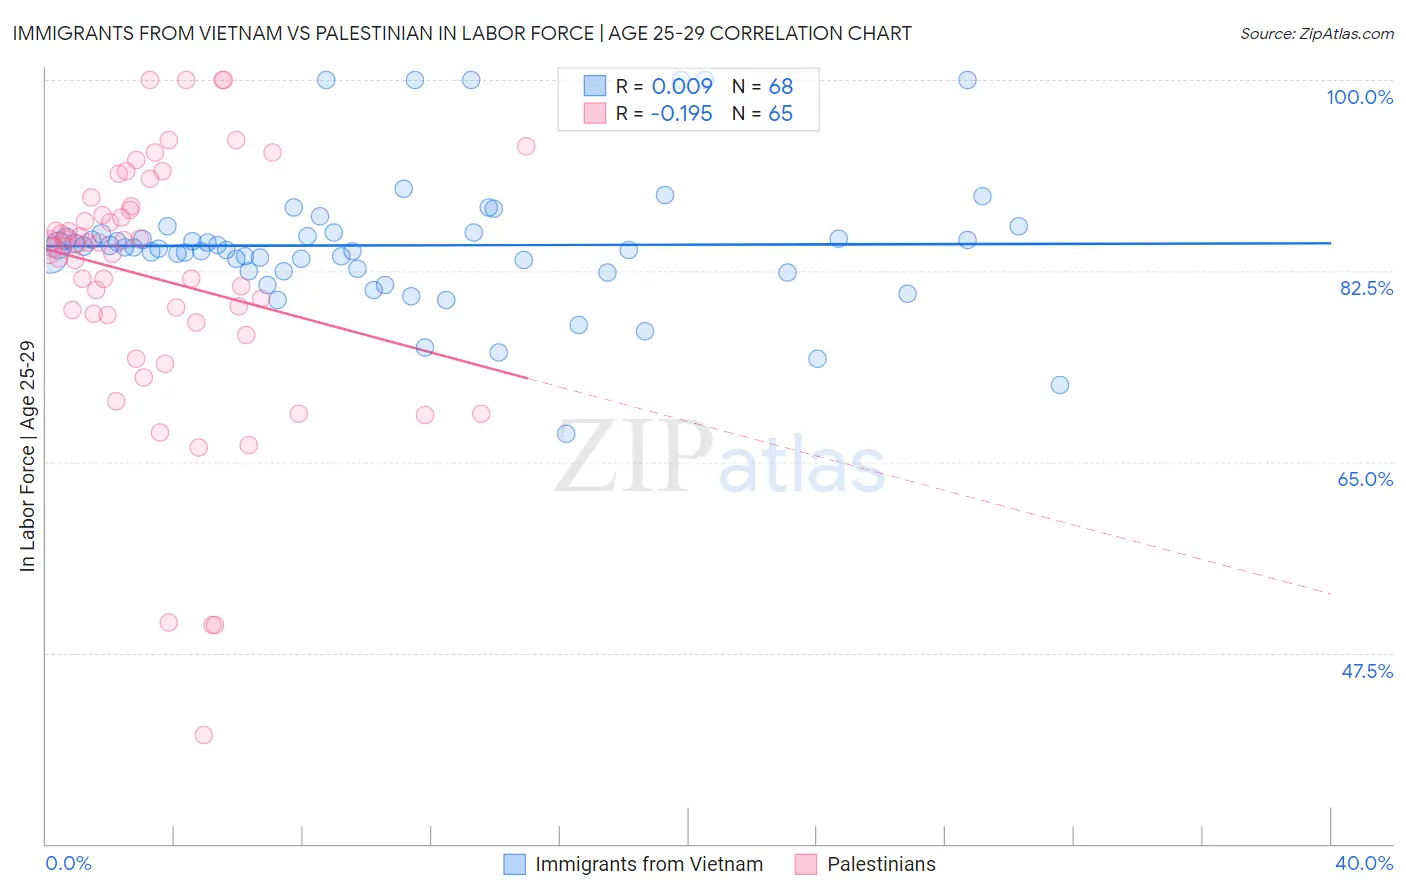
Immigrants from Vietnam vs Palestinian In Labor Force | Age 25-29 Correlation Chart
The statistical analysis conducted on geographies consisting of 404,726,104 people shows no correlation between the proportion of Immigrants from Vietnam and labor force participation rate among population between the ages 25 and 29 in the United States with a correlation coefficient (R) of 0.009 and weighted average of 84.7%. Similarly, the statistical analysis conducted on geographies consisting of 216,447,152 people shows a poor negative correlation between the proportion of Palestinians and labor force participation rate among population between the ages 25 and 29 in the United States with a correlation coefficient (R) of -0.195 and weighted average of 84.7%, a difference of 0.0%.
In Labor Force | Age 25-29 Correlation Summary
| Measurement | Immigrants from Vietnam | Palestinian |
| Minimum | 67.6% | 40.0% |
| Maximum | 100.0% | 100.0% |
| Range | 32.4% | 60.0% |
| Mean | 84.8% | 81.8% |
| Median | 84.6% | 84.8% |
| Interquartile 25% (IQ1) | 82.5% | 78.1% |
| Interquartile 75% (IQ3) | 85.9% | 88.2% |
| Interquartile Range (IQR) | 3.5% | 10.1% |
| Standard Deviation (Sample) | 6.2% | 12.1% |
| Standard Deviation (Population) | 6.1% | 12.0% |
Demographics Similar to Immigrants from Vietnam and Palestinians by In Labor Force | Age 25-29
In terms of in labor force | age 25-29, the demographic groups most similar to Immigrants from Vietnam are Immigrants from Western Europe (84.7%, a difference of 0.0%), Assyrian/Chaldean/Syriac (84.7%, a difference of 0.0%), Celtic (84.7%, a difference of 0.010%), Tongan (84.7%, a difference of 0.010%), and Hungarian (84.6%, a difference of 0.020%). Similarly, the demographic groups most similar to Palestinians are Immigrants from Western Europe (84.7%, a difference of 0.0%), Assyrian/Chaldean/Syriac (84.7%, a difference of 0.0%), Celtic (84.7%, a difference of 0.020%), Tongan (84.7%, a difference of 0.020%), and Hungarian (84.6%, a difference of 0.020%).
| Demographics | Rating | Rank | In Labor Force | Age 25-29 |
| Immigrants | Colombia | 58.3 /100 | #162 | Average 84.7% |
| Argentineans | 57.9 /100 | #163 | Average 84.7% |
| Ghanaians | 57.6 /100 | #164 | Average 84.7% |
| Immigrants | Burma/Myanmar | 57.4 /100 | #165 | Average 84.7% |
| Immigrants | Spain | 56.9 /100 | #166 | Average 84.7% |
| Indonesians | 56.5 /100 | #167 | Average 84.7% |
| South Americans | 54.9 /100 | #168 | Average 84.7% |
| Celtics | 52.5 /100 | #169 | Average 84.7% |
| Tongans | 52.4 /100 | #170 | Average 84.7% |
| Immigrants | Vietnam | 50.5 /100 | #171 | Average 84.7% |
| Immigrants | Western Europe | 50.4 /100 | #172 | Average 84.7% |
| Assyrians/Chaldeans/Syriacs | 50.2 /100 | #173 | Average 84.7% |
| Palestinians | 50.0 /100 | #174 | Average 84.7% |
| Hungarians | 47.8 /100 | #175 | Average 84.6% |
| Malaysians | 46.8 /100 | #176 | Average 84.6% |
| Immigrants | China | 45.7 /100 | #177 | Average 84.6% |
| Immigrants | Thailand | 45.2 /100 | #178 | Average 84.6% |
| Immigrants | Argentina | 44.0 /100 | #179 | Average 84.6% |
| Immigrants | South America | 42.9 /100 | #180 | Average 84.6% |
| Immigrants | Norway | 41.9 /100 | #181 | Average 84.6% |
| Europeans | 40.3 /100 | #182 | Average 84.6% |