Immigrants from Taiwan vs Immigrants from Portugal In Labor Force | Age 20-64
COMPARE
Immigrants from Taiwan
Immigrants from Portugal
In Labor Force | Age 20-64
In Labor Force | Age 20-64 Comparison
Immigrants from Taiwan
Immigrants from Portugal
80.0%
IN LABOR FORCE | AGE 20-64
92.5/ 100
METRIC RATING
119th/ 347
METRIC RANK
79.3%
IN LABOR FORCE | AGE 20-64
12.8/ 100
METRIC RATING
213th/ 347
METRIC RANK
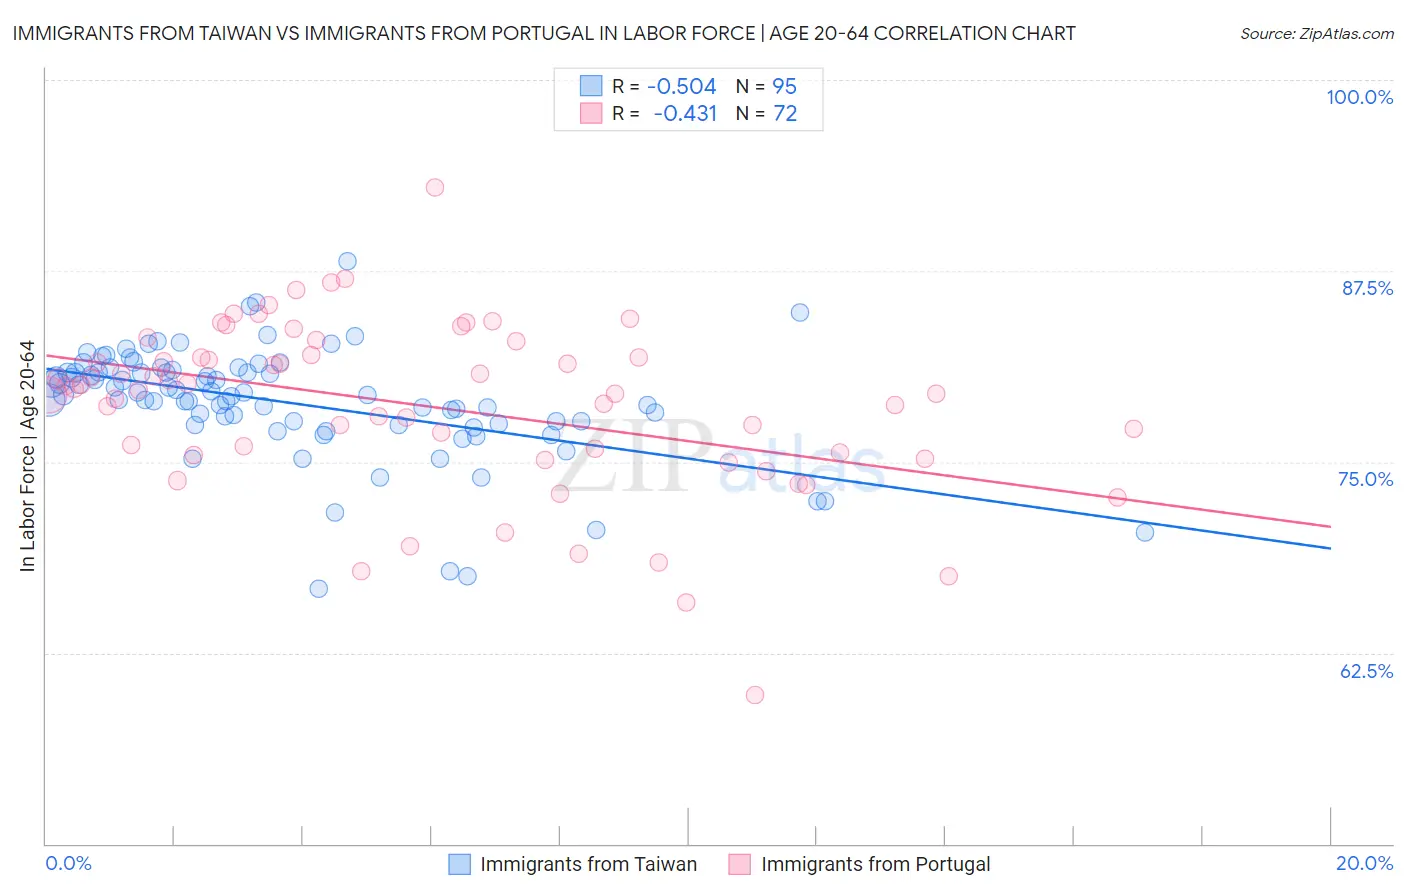
Immigrants from Taiwan vs Immigrants from Portugal In Labor Force | Age 20-64 Correlation Chart
The statistical analysis conducted on geographies consisting of 298,293,135 people shows a substantial negative correlation between the proportion of Immigrants from Taiwan and labor force participation rate among population between the ages 20 and 64 in the United States with a correlation coefficient (R) of -0.504 and weighted average of 80.0%. Similarly, the statistical analysis conducted on geographies consisting of 174,779,205 people shows a moderate negative correlation between the proportion of Immigrants from Portugal and labor force participation rate among population between the ages 20 and 64 in the United States with a correlation coefficient (R) of -0.431 and weighted average of 79.3%, a difference of 0.89%.
In Labor Force | Age 20-64 Correlation Summary
| Measurement | Immigrants from Taiwan | Immigrants from Portugal |
| Minimum | 66.7% | 59.7% |
| Maximum | 88.1% | 93.0% |
| Range | 21.4% | 33.3% |
| Mean | 78.9% | 78.7% |
| Median | 79.4% | 79.7% |
| Interquartile 25% (IQ1) | 77.5% | 75.5% |
| Interquartile 75% (IQ3) | 80.9% | 82.0% |
| Interquartile Range (IQR) | 3.4% | 6.4% |
| Standard Deviation (Sample) | 3.7% | 5.6% |
| Standard Deviation (Population) | 3.7% | 5.6% |
Similar Demographics by In Labor Force | Age 20-64
Demographics Similar to Immigrants from Taiwan by In Labor Force | Age 20-64
In terms of in labor force | age 20-64, the demographic groups most similar to Immigrants from Taiwan are Maltese (80.0%, a difference of 0.0%), Immigrants from Vietnam (80.0%, a difference of 0.010%), Cape Verdean (80.0%, a difference of 0.010%), Immigrants from Kuwait (80.0%, a difference of 0.010%), and Mongolian (79.9%, a difference of 0.010%).
| Demographics | Rating | Rank | In Labor Force | Age 20-64 |
| Immigrants | Italy | 93.9 /100 | #112 | Exceptional 80.0% |
| Sri Lankans | 93.9 /100 | #113 | Exceptional 80.0% |
| Argentineans | 93.8 /100 | #114 | Exceptional 80.0% |
| Bermudans | 93.3 /100 | #115 | Exceptional 80.0% |
| Immigrants | Western Africa | 93.1 /100 | #116 | Exceptional 80.0% |
| Immigrants | Vietnam | 92.7 /100 | #117 | Exceptional 80.0% |
| Cape Verdeans | 92.7 /100 | #118 | Exceptional 80.0% |
| Immigrants | Taiwan | 92.5 /100 | #119 | Exceptional 80.0% |
| Maltese | 92.4 /100 | #120 | Exceptional 80.0% |
| Immigrants | Kuwait | 92.2 /100 | #121 | Exceptional 80.0% |
| Mongolians | 92.0 /100 | #122 | Exceptional 79.9% |
| Immigrants | Russia | 91.8 /100 | #123 | Exceptional 79.9% |
| Immigrants | Europe | 91.6 /100 | #124 | Exceptional 79.9% |
| Danes | 91.5 /100 | #125 | Exceptional 79.9% |
| Immigrants | France | 90.7 /100 | #126 | Exceptional 79.9% |
Demographics Similar to Immigrants from Portugal by In Labor Force | Age 20-64
In terms of in labor force | age 20-64, the demographic groups most similar to Immigrants from Portugal are Irish (79.3%, a difference of 0.010%), Immigrants from Armenia (79.2%, a difference of 0.010%), Immigrants from Norway (79.2%, a difference of 0.020%), Arab (79.2%, a difference of 0.030%), and Immigrants from Western Asia (79.2%, a difference of 0.030%).
| Demographics | Rating | Rank | In Labor Force | Age 20-64 |
| Immigrants | Ecuador | 16.9 /100 | #206 | Poor 79.3% |
| Sub-Saharan Africans | 16.5 /100 | #207 | Poor 79.3% |
| British | 16.5 /100 | #208 | Poor 79.3% |
| Bangladeshis | 16.4 /100 | #209 | Poor 79.3% |
| Haitians | 16.1 /100 | #210 | Poor 79.3% |
| Europeans | 15.3 /100 | #211 | Poor 79.3% |
| Irish | 13.2 /100 | #212 | Poor 79.3% |
| Immigrants | Portugal | 12.8 /100 | #213 | Poor 79.3% |
| Immigrants | Armenia | 12.2 /100 | #214 | Poor 79.2% |
| Immigrants | Norway | 12.0 /100 | #215 | Poor 79.2% |
| Arabs | 11.4 /100 | #216 | Poor 79.2% |
| Immigrants | Western Asia | 11.0 /100 | #217 | Poor 79.2% |
| Immigrants | England | 9.3 /100 | #218 | Tragic 79.2% |
| French Canadians | 8.4 /100 | #219 | Tragic 79.2% |
| Immigrants | Immigrants | 7.7 /100 | #220 | Tragic 79.2% |