Immigrants from Syria vs Immigrants from Peru In Labor Force | Age 16-19
COMPARE
Immigrants from Syria
Immigrants from Peru
In Labor Force | Age 16-19
In Labor Force | Age 16-19 Comparison
Immigrants from Syria
Immigrants from Peru
35.2%
IN LABOR FORCE | AGE 16-19
4.5/ 100
METRIC RATING
231st/ 347
METRIC RANK
34.2%
IN LABOR FORCE | AGE 16-19
0.5/ 100
METRIC RATING
267th/ 347
METRIC RANK
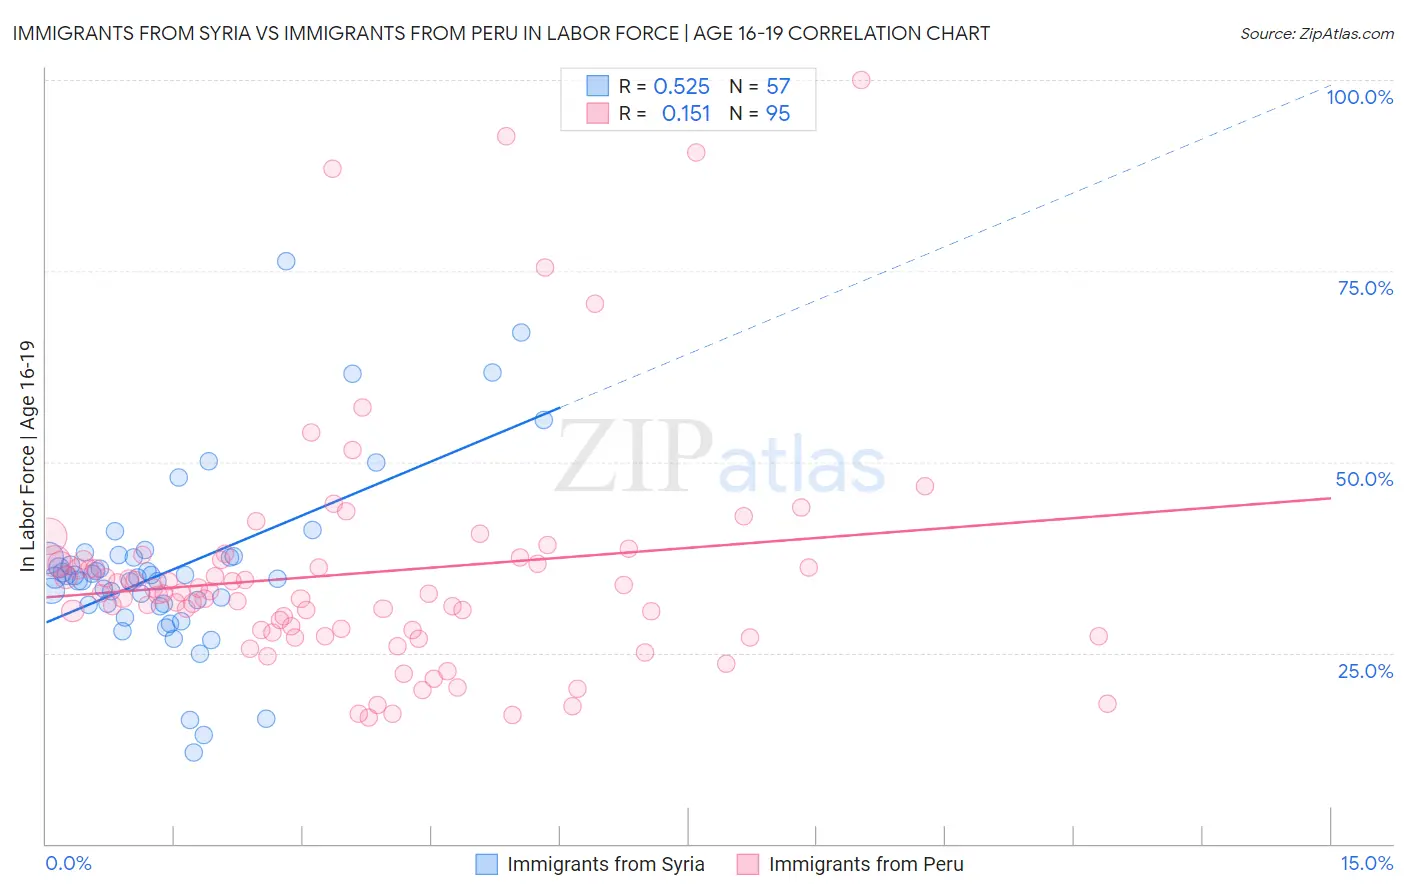
Immigrants from Syria vs Immigrants from Peru In Labor Force | Age 16-19 Correlation Chart
The statistical analysis conducted on geographies consisting of 174,056,881 people shows a substantial positive correlation between the proportion of Immigrants from Syria and labor force participation rate among population between the ages 16 and 19 in the United States with a correlation coefficient (R) of 0.525 and weighted average of 35.2%. Similarly, the statistical analysis conducted on geographies consisting of 328,524,721 people shows a poor positive correlation between the proportion of Immigrants from Peru and labor force participation rate among population between the ages 16 and 19 in the United States with a correlation coefficient (R) of 0.151 and weighted average of 34.2%, a difference of 2.9%.
In Labor Force | Age 16-19 Correlation Summary
| Measurement | Immigrants from Syria | Immigrants from Peru |
| Minimum | 12.0% | 16.5% |
| Maximum | 76.3% | 100.0% |
| Range | 64.3% | 83.5% |
| Mean | 36.0% | 35.4% |
| Median | 34.9% | 32.8% |
| Interquartile 25% (IQ1) | 31.3% | 27.7% |
| Interquartile 75% (IQ3) | 37.5% | 37.1% |
| Interquartile Range (IQR) | 6.2% | 9.5% |
| Standard Deviation (Sample) | 11.5% | 15.6% |
| Standard Deviation (Population) | 11.4% | 15.5% |
Similar Demographics by In Labor Force | Age 16-19
Demographics Similar to Immigrants from Syria by In Labor Force | Age 16-19
In terms of in labor force | age 16-19, the demographic groups most similar to Immigrants from Syria are Immigrants from Kazakhstan (35.2%, a difference of 0.0%), Immigrants from France (35.1%, a difference of 0.040%), Immigrants from Mexico (35.1%, a difference of 0.080%), Immigrants from Honduras (35.2%, a difference of 0.12%), and Immigrants from Lebanon (35.2%, a difference of 0.15%).
| Demographics | Rating | Rank | In Labor Force | Age 16-19 |
| Hondurans | 6.5 /100 | #224 | Tragic 35.3% |
| Immigrants | Belgium | 6.1 /100 | #225 | Tragic 35.3% |
| Immigrants | Guatemala | 5.7 /100 | #226 | Tragic 35.3% |
| Mongolians | 5.7 /100 | #227 | Tragic 35.3% |
| Immigrants | Senegal | 5.5 /100 | #228 | Tragic 35.3% |
| Immigrants | Lebanon | 5.0 /100 | #229 | Tragic 35.2% |
| Immigrants | Honduras | 4.9 /100 | #230 | Tragic 35.2% |
| Immigrants | Syria | 4.5 /100 | #231 | Tragic 35.2% |
| Immigrants | Kazakhstan | 4.5 /100 | #232 | Tragic 35.2% |
| Immigrants | France | 4.3 /100 | #233 | Tragic 35.1% |
| Immigrants | Mexico | 4.2 /100 | #234 | Tragic 35.1% |
| Immigrants | Philippines | 4.0 /100 | #235 | Tragic 35.1% |
| Immigrants | Australia | 3.6 /100 | #236 | Tragic 35.1% |
| Immigrants | India | 3.5 /100 | #237 | Tragic 35.0% |
| Immigrants | Vietnam | 3.4 /100 | #238 | Tragic 35.0% |
Demographics Similar to Immigrants from Peru by In Labor Force | Age 16-19
In terms of in labor force | age 16-19, the demographic groups most similar to Immigrants from Peru are Immigrants from Asia (34.1%, a difference of 0.12%), Pima (34.1%, a difference of 0.20%), Immigrants from Russia (34.1%, a difference of 0.25%), Central American Indian (34.1%, a difference of 0.25%), and Asian (34.1%, a difference of 0.28%).
| Demographics | Rating | Rank | In Labor Force | Age 16-19 |
| Egyptians | 1.2 /100 | #260 | Tragic 34.5% |
| Salvadorans | 1.1 /100 | #261 | Tragic 34.5% |
| Hispanics or Latinos | 1.1 /100 | #262 | Tragic 34.5% |
| Burmese | 1.1 /100 | #263 | Tragic 34.5% |
| Immigrants | Uruguay | 0.9 /100 | #264 | Tragic 34.4% |
| Immigrants | El Salvador | 0.7 /100 | #265 | Tragic 34.3% |
| Immigrants | Malaysia | 0.7 /100 | #266 | Tragic 34.3% |
| Immigrants | Peru | 0.5 /100 | #267 | Tragic 34.2% |
| Immigrants | Asia | 0.5 /100 | #268 | Tragic 34.1% |
| Pima | 0.5 /100 | #269 | Tragic 34.1% |
| Immigrants | Russia | 0.4 /100 | #270 | Tragic 34.1% |
| Central American Indians | 0.4 /100 | #271 | Tragic 34.1% |
| Asians | 0.4 /100 | #272 | Tragic 34.1% |
| Immigrants | Panama | 0.4 /100 | #273 | Tragic 34.0% |
| Venezuelans | 0.3 /100 | #274 | Tragic 34.0% |