Immigrants from Sudan vs Palestinian In Labor Force | Age 25-29
COMPARE
Immigrants from Sudan
Palestinian
In Labor Force | Age 25-29
In Labor Force | Age 25-29 Comparison
Immigrants from Sudan
Palestinians
85.1%
IN LABOR FORCE | AGE 25-29
94.3/ 100
METRIC RATING
97th/ 347
METRIC RANK
84.7%
IN LABOR FORCE | AGE 25-29
50.0/ 100
METRIC RATING
174th/ 347
METRIC RANK
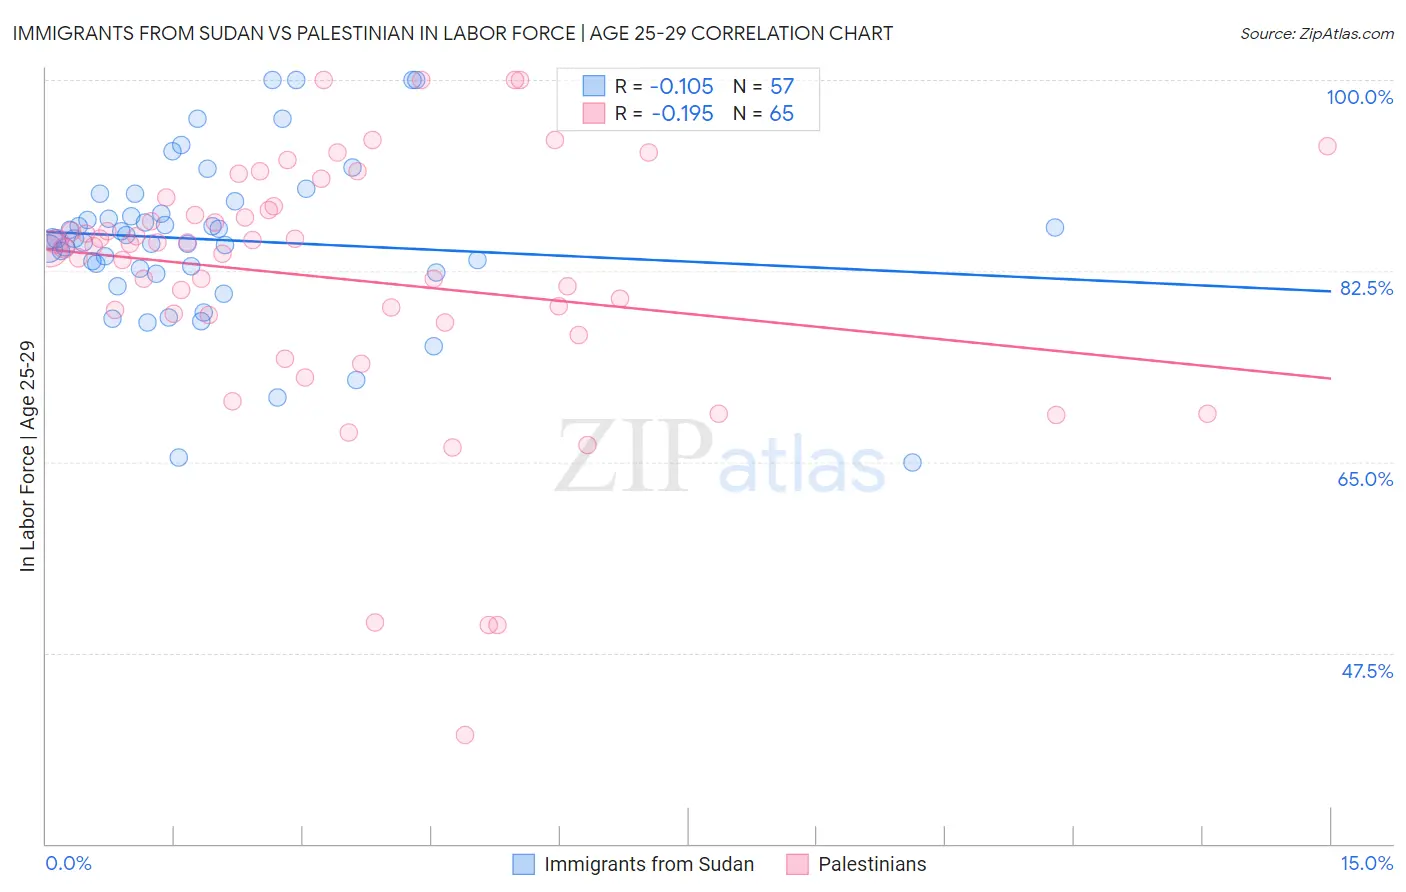
Immigrants from Sudan vs Palestinian In Labor Force | Age 25-29 Correlation Chart
The statistical analysis conducted on geographies consisting of 118,966,602 people shows a poor negative correlation between the proportion of Immigrants from Sudan and labor force participation rate among population between the ages 25 and 29 in the United States with a correlation coefficient (R) of -0.105 and weighted average of 85.1%. Similarly, the statistical analysis conducted on geographies consisting of 216,447,152 people shows a poor negative correlation between the proportion of Palestinians and labor force participation rate among population between the ages 25 and 29 in the United States with a correlation coefficient (R) of -0.195 and weighted average of 84.7%, a difference of 0.52%.
In Labor Force | Age 25-29 Correlation Summary
| Measurement | Immigrants from Sudan | Palestinian |
| Minimum | 64.9% | 40.0% |
| Maximum | 100.0% | 100.0% |
| Range | 35.1% | 60.0% |
| Mean | 85.4% | 81.8% |
| Median | 85.5% | 84.8% |
| Interquartile 25% (IQ1) | 82.6% | 78.1% |
| Interquartile 75% (IQ3) | 88.3% | 88.2% |
| Interquartile Range (IQR) | 5.8% | 10.1% |
| Standard Deviation (Sample) | 7.4% | 12.1% |
| Standard Deviation (Population) | 7.3% | 12.0% |
Similar Demographics by In Labor Force | Age 25-29
Demographics Similar to Immigrants from Sudan by In Labor Force | Age 25-29
In terms of in labor force | age 25-29, the demographic groups most similar to Immigrants from Sudan are Immigrants from Netherlands (85.1%, a difference of 0.010%), Immigrants from Romania (85.1%, a difference of 0.010%), Mongolian (85.1%, a difference of 0.010%), Bangladeshi (85.1%, a difference of 0.010%), and Immigrants from Switzerland (85.1%, a difference of 0.010%).
| Demographics | Rating | Rank | In Labor Force | Age 25-29 |
| Burmese | 95.9 /100 | #90 | Exceptional 85.1% |
| Immigrants | Moldova | 95.8 /100 | #91 | Exceptional 85.1% |
| Immigrants | Costa Rica | 95.5 /100 | #92 | Exceptional 85.1% |
| Austrians | 95.3 /100 | #93 | Exceptional 85.1% |
| Immigrants | Korea | 94.8 /100 | #94 | Exceptional 85.1% |
| Immigrants | Netherlands | 94.6 /100 | #95 | Exceptional 85.1% |
| Immigrants | Romania | 94.6 /100 | #96 | Exceptional 85.1% |
| Immigrants | Sudan | 94.3 /100 | #97 | Exceptional 85.1% |
| Mongolians | 94.1 /100 | #98 | Exceptional 85.1% |
| Bangladeshis | 94.0 /100 | #99 | Exceptional 85.1% |
| Immigrants | Switzerland | 93.9 /100 | #100 | Exceptional 85.1% |
| Egyptians | 93.8 /100 | #101 | Exceptional 85.1% |
| Slavs | 93.7 /100 | #102 | Exceptional 85.1% |
| Immigrants | Japan | 93.5 /100 | #103 | Exceptional 85.1% |
| Immigrants | Zaire | 93.3 /100 | #104 | Exceptional 85.1% |
Demographics Similar to Palestinians by In Labor Force | Age 25-29
In terms of in labor force | age 25-29, the demographic groups most similar to Palestinians are Immigrants from Vietnam (84.7%, a difference of 0.0%), Immigrants from Western Europe (84.7%, a difference of 0.0%), Assyrian/Chaldean/Syriac (84.7%, a difference of 0.0%), Celtic (84.7%, a difference of 0.020%), and Tongan (84.7%, a difference of 0.020%).
| Demographics | Rating | Rank | In Labor Force | Age 25-29 |
| Indonesians | 56.5 /100 | #167 | Average 84.7% |
| South Americans | 54.9 /100 | #168 | Average 84.7% |
| Celtics | 52.5 /100 | #169 | Average 84.7% |
| Tongans | 52.4 /100 | #170 | Average 84.7% |
| Immigrants | Vietnam | 50.5 /100 | #171 | Average 84.7% |
| Immigrants | Western Europe | 50.4 /100 | #172 | Average 84.7% |
| Assyrians/Chaldeans/Syriacs | 50.2 /100 | #173 | Average 84.7% |
| Palestinians | 50.0 /100 | #174 | Average 84.7% |
| Hungarians | 47.8 /100 | #175 | Average 84.6% |
| Malaysians | 46.8 /100 | #176 | Average 84.6% |
| Immigrants | China | 45.7 /100 | #177 | Average 84.6% |
| Immigrants | Thailand | 45.2 /100 | #178 | Average 84.6% |
| Immigrants | Argentina | 44.0 /100 | #179 | Average 84.6% |
| Immigrants | South America | 42.9 /100 | #180 | Average 84.6% |
| Immigrants | Norway | 41.9 /100 | #181 | Average 84.6% |