Immigrants from South America vs Immigrants from Fiji In Labor Force | Age 16-19
COMPARE
Immigrants from South America
Immigrants from Fiji
In Labor Force | Age 16-19
In Labor Force | Age 16-19 Comparison
Immigrants from South America
Immigrants from Fiji
33.3%
IN LABOR FORCE | AGE 16-19
0.1/ 100
METRIC RATING
293rd/ 347
METRIC RANK
33.9%
IN LABOR FORCE | AGE 16-19
0.3/ 100
METRIC RATING
275th/ 347
METRIC RANK
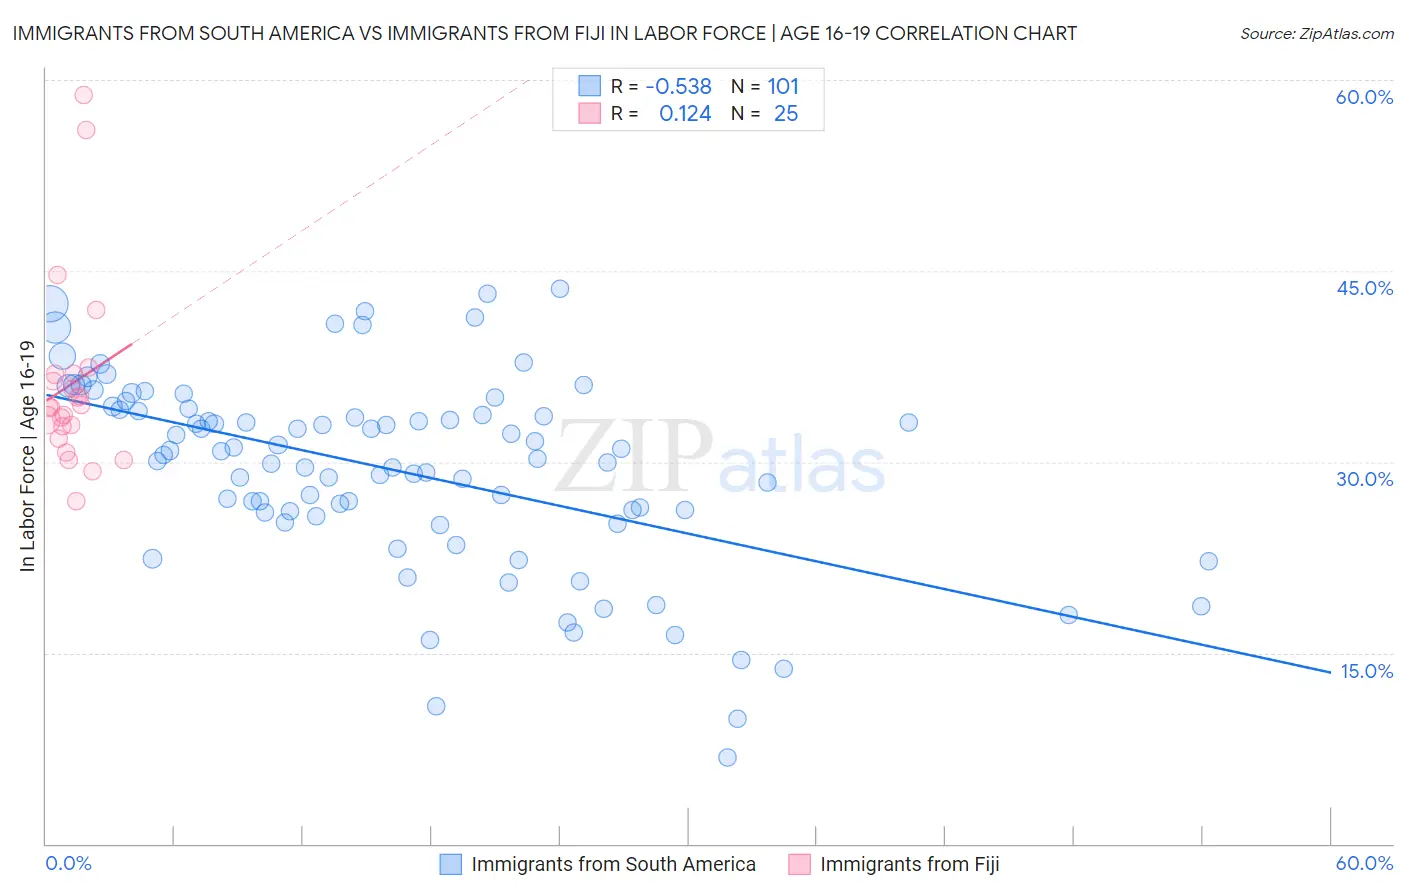
Immigrants from South America vs Immigrants from Fiji In Labor Force | Age 16-19 Correlation Chart
The statistical analysis conducted on geographies consisting of 485,146,560 people shows a substantial negative correlation between the proportion of Immigrants from South America and labor force participation rate among population between the ages 16 and 19 in the United States with a correlation coefficient (R) of -0.538 and weighted average of 33.3%. Similarly, the statistical analysis conducted on geographies consisting of 93,728,975 people shows a poor positive correlation between the proportion of Immigrants from Fiji and labor force participation rate among population between the ages 16 and 19 in the United States with a correlation coefficient (R) of 0.124 and weighted average of 33.9%, a difference of 1.9%.
In Labor Force | Age 16-19 Correlation Summary
| Measurement | Immigrants from South America | Immigrants from Fiji |
| Minimum | 6.8% | 26.9% |
| Maximum | 43.6% | 58.8% |
| Range | 36.8% | 31.9% |
| Mean | 29.4% | 36.1% |
| Median | 30.6% | 34.3% |
| Interquartile 25% (IQ1) | 25.9% | 32.3% |
| Interquartile 75% (IQ3) | 34.2% | 36.9% |
| Interquartile Range (IQR) | 8.3% | 4.6% |
| Standard Deviation (Sample) | 7.6% | 7.4% |
| Standard Deviation (Population) | 7.5% | 7.3% |
Demographics Similar to Immigrants from South America and Immigrants from Fiji by In Labor Force | Age 16-19
In terms of in labor force | age 16-19, the demographic groups most similar to Immigrants from South America are Argentinean (33.3%, a difference of 0.020%), Haitian (33.4%, a difference of 0.32%), Immigrants from Belarus (33.4%, a difference of 0.38%), Immigrants from Colombia (33.5%, a difference of 0.46%), and Immigrants from Indonesia (33.5%, a difference of 0.60%). Similarly, the demographic groups most similar to Immigrants from Fiji are Venezuelan (34.0%, a difference of 0.090%), Immigrants from Latin America (33.9%, a difference of 0.10%), Menominee (33.9%, a difference of 0.22%), Colombian (33.8%, a difference of 0.29%), and Paraguayan (33.8%, a difference of 0.30%).
| Demographics | Rating | Rank | In Labor Force | Age 16-19 |
| Venezuelans | 0.3 /100 | #274 | Tragic 34.0% |
| Immigrants | Fiji | 0.3 /100 | #275 | Tragic 33.9% |
| Immigrants | Latin America | 0.3 /100 | #276 | Tragic 33.9% |
| Menominee | 0.3 /100 | #277 | Tragic 33.9% |
| Colombians | 0.3 /100 | #278 | Tragic 33.8% |
| Paraguayans | 0.3 /100 | #279 | Tragic 33.8% |
| Taiwanese | 0.3 /100 | #280 | Tragic 33.8% |
| Cypriots | 0.3 /100 | #281 | Tragic 33.8% |
| Immigrants | Korea | 0.3 /100 | #282 | Tragic 33.8% |
| Immigrants | Venezuela | 0.2 /100 | #283 | Tragic 33.7% |
| Immigrants | Spain | 0.2 /100 | #284 | Tragic 33.7% |
| U.S. Virgin Islanders | 0.2 /100 | #285 | Tragic 33.6% |
| South Americans | 0.2 /100 | #286 | Tragic 33.6% |
| Nepalese | 0.1 /100 | #287 | Tragic 33.5% |
| Immigrants | Indonesia | 0.1 /100 | #288 | Tragic 33.5% |
| Immigrants | Singapore | 0.1 /100 | #289 | Tragic 33.5% |
| Immigrants | Colombia | 0.1 /100 | #290 | Tragic 33.5% |
| Immigrants | Belarus | 0.1 /100 | #291 | Tragic 33.4% |
| Haitians | 0.1 /100 | #292 | Tragic 33.4% |
| Immigrants | South America | 0.1 /100 | #293 | Tragic 33.3% |
| Argentineans | 0.1 /100 | #294 | Tragic 33.3% |