Immigrants from South Africa vs Immigrants from Dominica In Labor Force | Age 30-34
COMPARE
Immigrants from South Africa
Immigrants from Dominica
In Labor Force | Age 30-34
In Labor Force | Age 30-34 Comparison
Immigrants from South Africa
Immigrants from Dominica
85.1%
IN LABOR FORCE | AGE 30-34
95.3/ 100
METRIC RATING
110th/ 347
METRIC RANK
84.0%
IN LABOR FORCE | AGE 30-34
0.7/ 100
METRIC RATING
249th/ 347
METRIC RANK
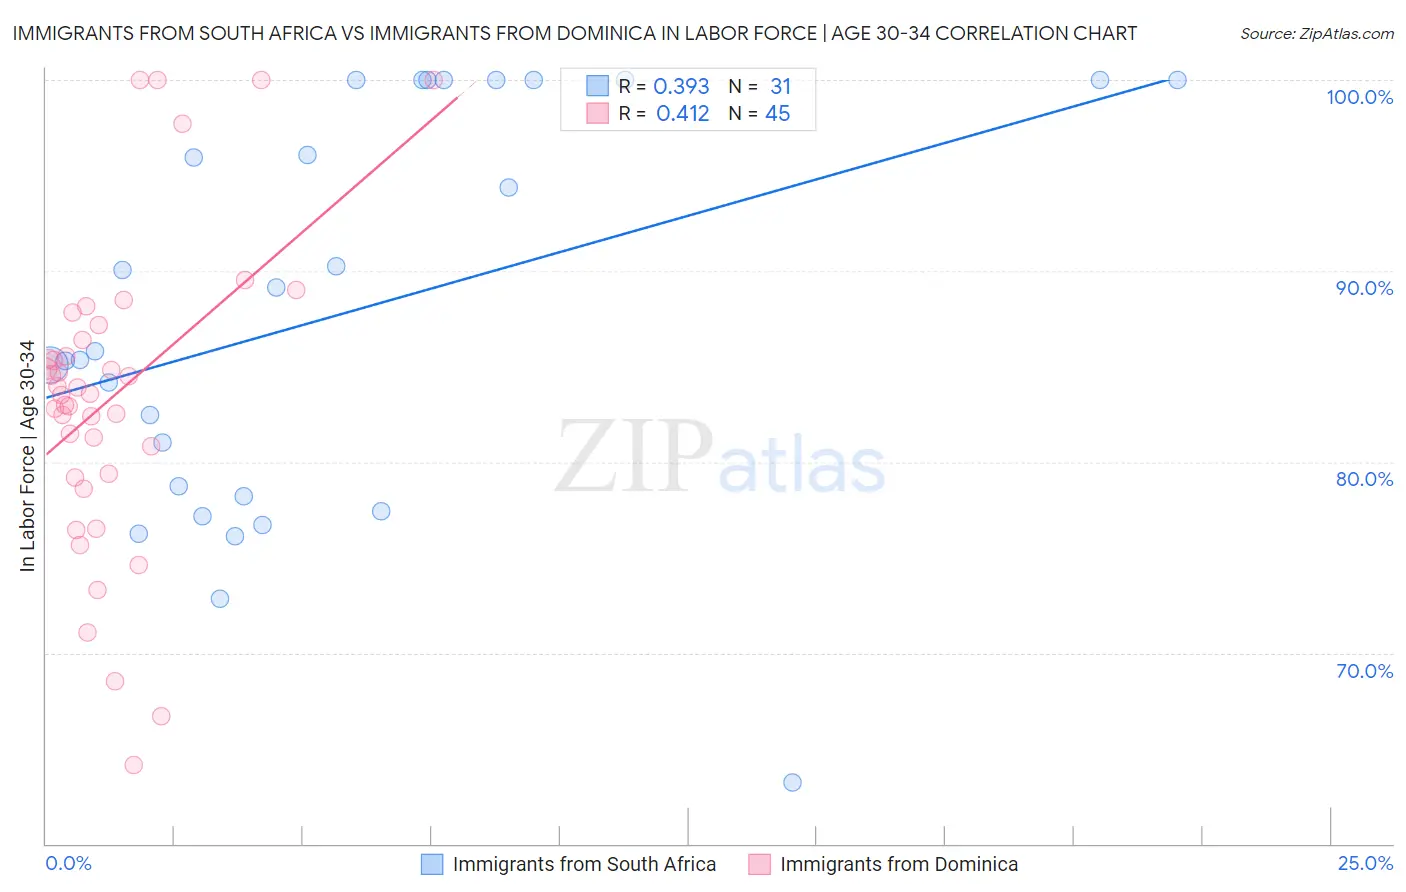
Immigrants from South Africa vs Immigrants from Dominica In Labor Force | Age 30-34 Correlation Chart
The statistical analysis conducted on geographies consisting of 233,236,672 people shows a mild positive correlation between the proportion of Immigrants from South Africa and labor force participation rate among population between the ages 30 and 34 in the United States with a correlation coefficient (R) of 0.393 and weighted average of 85.1%. Similarly, the statistical analysis conducted on geographies consisting of 83,795,636 people shows a moderate positive correlation between the proportion of Immigrants from Dominica and labor force participation rate among population between the ages 30 and 34 in the United States with a correlation coefficient (R) of 0.412 and weighted average of 84.0%, a difference of 1.4%.
In Labor Force | Age 30-34 Correlation Summary
| Measurement | Immigrants from South Africa | Immigrants from Dominica |
| Minimum | 63.2% | 64.1% |
| Maximum | 100.0% | 100.0% |
| Range | 36.8% | 35.9% |
| Mean | 87.8% | 83.4% |
| Median | 85.8% | 83.6% |
| Interquartile 25% (IQ1) | 78.2% | 79.3% |
| Interquartile 75% (IQ3) | 100.0% | 86.8% |
| Interquartile Range (IQR) | 21.8% | 7.5% |
| Standard Deviation (Sample) | 10.4% | 8.2% |
| Standard Deviation (Population) | 10.3% | 8.1% |
Similar Demographics by In Labor Force | Age 30-34
Demographics Similar to Immigrants from South Africa by In Labor Force | Age 30-34
In terms of in labor force | age 30-34, the demographic groups most similar to Immigrants from South Africa are Immigrants from Zimbabwe (85.1%, a difference of 0.020%), Argentinean (85.1%, a difference of 0.020%), Immigrants from Scotland (85.1%, a difference of 0.020%), Immigrants from Hungary (85.1%, a difference of 0.020%), and Immigrants from Romania (85.1%, a difference of 0.020%).
| Demographics | Rating | Rank | In Labor Force | Age 30-34 |
| Ukrainians | 96.6 /100 | #103 | Exceptional 85.2% |
| Immigrants | Ghana | 96.5 /100 | #104 | Exceptional 85.2% |
| Alsatians | 96.3 /100 | #105 | Exceptional 85.2% |
| Immigrants | Middle Africa | 96.3 /100 | #106 | Exceptional 85.2% |
| Immigrants | Northern Africa | 96.3 /100 | #107 | Exceptional 85.2% |
| Immigrants | Zimbabwe | 95.8 /100 | #108 | Exceptional 85.1% |
| Argentineans | 95.8 /100 | #109 | Exceptional 85.1% |
| Immigrants | South Africa | 95.3 /100 | #110 | Exceptional 85.1% |
| Immigrants | Scotland | 94.9 /100 | #111 | Exceptional 85.1% |
| Immigrants | Hungary | 94.8 /100 | #112 | Exceptional 85.1% |
| Immigrants | Romania | 94.7 /100 | #113 | Exceptional 85.1% |
| Yugoslavians | 94.7 /100 | #114 | Exceptional 85.1% |
| Immigrants | South Central Asia | 94.6 /100 | #115 | Exceptional 85.1% |
| Egyptians | 94.5 /100 | #116 | Exceptional 85.1% |
| Immigrants | Denmark | 94.3 /100 | #117 | Exceptional 85.1% |
Demographics Similar to Immigrants from Dominica by In Labor Force | Age 30-34
In terms of in labor force | age 30-34, the demographic groups most similar to Immigrants from Dominica are Portuguese (84.0%, a difference of 0.0%), British West Indian (84.0%, a difference of 0.020%), Immigrants from Iraq (83.9%, a difference of 0.020%), Basque (84.0%, a difference of 0.040%), and Immigrants from Venezuela (84.0%, a difference of 0.040%).
| Demographics | Rating | Rank | In Labor Force | Age 30-34 |
| Immigrants | Oceania | 1.1 /100 | #242 | Tragic 84.0% |
| Immigrants | Caribbean | 1.1 /100 | #243 | Tragic 84.0% |
| Basques | 0.9 /100 | #244 | Tragic 84.0% |
| Immigrants | Venezuela | 0.9 /100 | #245 | Tragic 84.0% |
| Central Americans | 0.9 /100 | #246 | Tragic 84.0% |
| British West Indians | 0.8 /100 | #247 | Tragic 84.0% |
| Portuguese | 0.8 /100 | #248 | Tragic 84.0% |
| Immigrants | Dominica | 0.7 /100 | #249 | Tragic 84.0% |
| Immigrants | Iraq | 0.7 /100 | #250 | Tragic 83.9% |
| Nicaraguans | 0.6 /100 | #251 | Tragic 83.9% |
| Bahamians | 0.6 /100 | #252 | Tragic 83.9% |
| Immigrants | Nicaragua | 0.6 /100 | #253 | Tragic 83.9% |
| Immigrants | St. Vincent and the Grenadines | 0.5 /100 | #254 | Tragic 83.9% |
| Whites/Caucasians | 0.5 /100 | #255 | Tragic 83.9% |
| Immigrants | Lebanon | 0.4 /100 | #256 | Tragic 83.9% |