Okinawan vs Immigrants from Grenada In Labor Force | Age 35-44

COMPARE

Okinawan
Race
Ancestry
AfghanAfricanAlaska NativeAlaskan AthabascanAlbanianAleutAlsatianAmericanApacheArabArapahoArgentineanArmenianAssyrian/Chaldean/SyriacAustralianAustrianBahamianBangladeshiBarbadianBasqueBelgianBelizeanBermudanBhutaneseBlackfeetBolivianBrazilianBritishBritish West IndianBulgarianBurmeseCajunCambodianCanadianCape VerdeanCarpatho RusynCelticCentral AmericanCentral American IndianCherokeeCheyenneChickasawChileanChineseChippewaChoctawColombianColvilleComancheCosta RicanCreeCreekCroatianCrowCubanCypriotCzechCzechoslovakianDanishDelawareDominicanDutchDutch West IndianEastern EuropeanEcuadorianEgyptianEnglishEstonianEthiopianEuropeanFijianFilipinoFinnishFrenchFrench American IndianFrench CanadianGermanGerman RussianGhanaianGreekGuamanian/ChamorroGuatemalanGuyaneseHaitianHmongHonduranHopiHoumaHungarianIcelanderIndian (Asian)IndonesianInupiatIranianIraqiIrishIroquoisIsraeliItalianJamaicanJapaneseJordanianKenyanKiowaKoreanLaotianLatvianLebaneseLiberianLithuanianLumbeeLuxembourgerMacedonianMalaysianMalteseMarshalleseMenomineeMexicanMexican American IndianMongolianMoroccanNative HawaiianNavajoNepaleseNew ZealanderNicaraguanNigerianNorthern EuropeanNorwegianOkinawanOsageOttawaPaiutePakistaniPalestinianPanamanianParaguayanPennsylvania GermanPeruvianPimaPolishPortuguesePotawatomiPuebloPuerto RicanPuget Sound SalishRomanianRussianSalvadoranSamoanScandinavianScotch-IrishScottishSeminoleSenegaleseSerbianShoshoneSierra LeoneanSiouxSlavicSlovakSloveneSomaliSouth AfricanSouth AmericanSouth American IndianSoviet UnionSpaniardSpanishSpanish AmericanSpanish American IndianSri LankanSubsaharan AfricanSudaneseSwedishSwissSyrianTaiwaneseThaiTlingit-HaidaTohono O'OdhamTonganTrinidadian and TobagonianTsimshianTurkishU.S. Virgin IslanderUgandanUkrainianUruguayanUteVenezuelanVietnameseWelshWest IndianYakamaYaquiYugoslavianYumanYup'ikZimbabwean
Immigration
NonimmigrantsImmigrantsAfghanistanAfricaAlbaniaArgentinaArmeniaAsiaAustraliaAustriaBahamasBangladeshBarbadosBelarusBelgiumBelizeBoliviaBosnia and HerzegovinaBrazilBulgariaBurma/MyanmarCabo VerdeCambodiaCameroonCanadaCaribbeanCentral AmericaChileChinaColombiaCongoCosta RicaCroatiaCubaCzechoslovakiaDenmarkDominicaDominican RepublicEastern AfricaEastern AsiaEastern EuropeEcuadorEgyptEl SalvadorEnglandEritreaEthiopiaEuropeFijiFranceGermanyGhanaGreeceGuatemalaGuyanaHaitiHondurasHong KongHungaryIndiaIndonesiaIranIraqIrelandIsraelItalyJamaicaJapanJordanKazakhstanKenyaKoreaKuwaitLaosLatin AmericaLatviaLebanonLiberiaLithuaniaMalaysiaMexicoMicronesiaMiddle AfricaMoldovaMoroccoNepalNetherlandsNicaraguaNigeriaNorth AmericaNorth MacedoniaNorthern AfricaNorthern EuropeNorwayOceaniaPakistanPanamaPeruPhilippinesPolandPortugalRomaniaRussiaSaudi ArabiaScotlandSenegalSerbiaSierra LeoneSingaporeSomaliaSouth AfricaSouth AmericaSouth Central AsiaSouth Eastern AsiaSouthern EuropeSpainSri LankaSt. Vincent and the GrenadinesSudanSwedenSwitzerlandSyriaTaiwanThailandTrinidad and TobagoTurkeyUgandaUkraineUruguayUzbekistanVenezuelaVietnamWest IndiesWestern AfricaWestern AsiaWestern EuropeYemenZaireZimbabweAzores
Immigrants from Grenada
Race
Ancestry
AfghanAfricanAlaska NativeAlaskan AthabascanAlbanianAleutAlsatianAmericanApacheArabArapahoArgentineanArmenianAssyrian/Chaldean/SyriacAustralianAustrianBahamianBangladeshiBarbadianBasqueBelgianBelizeanBermudanBhutaneseBlackfeetBolivianBrazilianBritishBritish West IndianBulgarianBurmeseCajunCambodianCanadianCape VerdeanCarpatho RusynCelticCentral AmericanCentral American IndianCherokeeCheyenneChickasawChileanChineseChippewaChoctawColombianColvilleComancheCosta RicanCreeCreekCroatianCrowCubanCypriotCzechCzechoslovakianDanishDelawareDominicanDutchDutch West IndianEastern EuropeanEcuadorianEgyptianEnglishEstonianEthiopianEuropeanFijianFilipinoFinnishFrenchFrench American IndianFrench CanadianGermanGerman RussianGhanaianGreekGuamanian/ChamorroGuatemalanGuyaneseHaitianHmongHonduranHopiHoumaHungarianIcelanderIndian (Asian)IndonesianInupiatIranianIraqiIrishIroquoisIsraeliItalianJamaicanJapaneseJordanianKenyanKiowaKoreanLaotianLatvianLebaneseLiberianLithuanianLumbeeLuxembourgerMacedonianMalaysianMalteseMarshalleseMenomineeMexicanMexican American IndianMongolianMoroccanNative HawaiianNavajoNepaleseNew ZealanderNicaraguanNigerianNorthern EuropeanNorwegianOsageOttawaPaiutePakistaniPalestinianPanamanianParaguayanPennsylvania GermanPeruvianPimaPolishPortuguesePotawatomiPuebloPuerto RicanPuget Sound SalishRomanianRussianSalvadoranSamoanScandinavianScotch-IrishScottishSeminoleSenegaleseSerbianShoshoneSierra LeoneanSiouxSlavicSlovakSloveneSomaliSouth AfricanSouth AmericanSouth American IndianSoviet UnionSpaniardSpanishSpanish AmericanSpanish American IndianSri LankanSubsaharan AfricanSudaneseSwedishSwissSyrianTaiwaneseThaiTlingit-HaidaTohono O'OdhamTonganTrinidadian and TobagonianTsimshianTurkishU.S. Virgin IslanderUgandanUkrainianUruguayanUteVenezuelanVietnameseWelshWest IndianYakamaYaquiYugoslavianYumanYup'ikZimbabwean
Immigration
NonimmigrantsImmigrantsAfghanistanAfricaAlbaniaArgentinaArmeniaAsiaAustraliaAustriaBahamasBangladeshBarbadosBelarusBelgiumBelizeBoliviaBosnia and HerzegovinaBrazilBulgariaBurma/MyanmarCabo VerdeCambodiaCameroonCanadaCaribbeanCentral AmericaChileChinaColombiaCongoCosta RicaCroatiaCubaCzechoslovakiaDenmarkDominicaDominican RepublicEastern AfricaEastern AsiaEastern EuropeEcuadorEgyptEl SalvadorEnglandEritreaEthiopiaEuropeFijiFranceGermanyGhanaGreeceGrenadaGuatemalaGuyanaHaitiHondurasHong KongHungaryIndiaIndonesiaIranIraqIrelandIsraelItalyJamaicaJapanJordanKazakhstanKenyaKoreaKuwaitLaosLatin AmericaLatviaLebanonLiberiaLithuaniaMalaysiaMexicoMicronesiaMiddle AfricaMoldovaMoroccoNepalNetherlandsNicaraguaNigeriaNorth AmericaNorth MacedoniaNorthern AfricaNorthern EuropeNorwayOceaniaPakistanPanamaPeruPhilippinesPolandPortugalRomaniaRussiaSaudi ArabiaScotlandSenegalSerbiaSierra LeoneSingaporeSomaliaSouth AfricaSouth AmericaSouth Central AsiaSouth Eastern AsiaSouthern EuropeSpainSri LankaSt. Vincent and the GrenadinesSudanSwedenSwitzerlandSyriaTaiwanThailandTrinidad and TobagoTurkeyUgandaUkraineUruguayUzbekistanVenezuelaVietnamWest IndiesWestern AfricaWestern AsiaWestern EuropeYemenZaireZimbabweAzores
In Labor Force | Age 35-44
Income
Poverty
Unemployment
Labor Participation
Family Structure
Vehicle Availability
Education Level
Disability

In Labor Force | Age 35-44 Comparison

Okinawans

Immigrants from Grenada

Good
Tragic
84.5%
IN LABOR FORCE | AGE 35-44
73.5/ 100
METRIC RATING
149th/ 347
METRIC RANK
83.3%
IN LABOR FORCE | AGE 35-44
0.1/ 100
METRIC RATING
269th/ 347
METRIC RANK

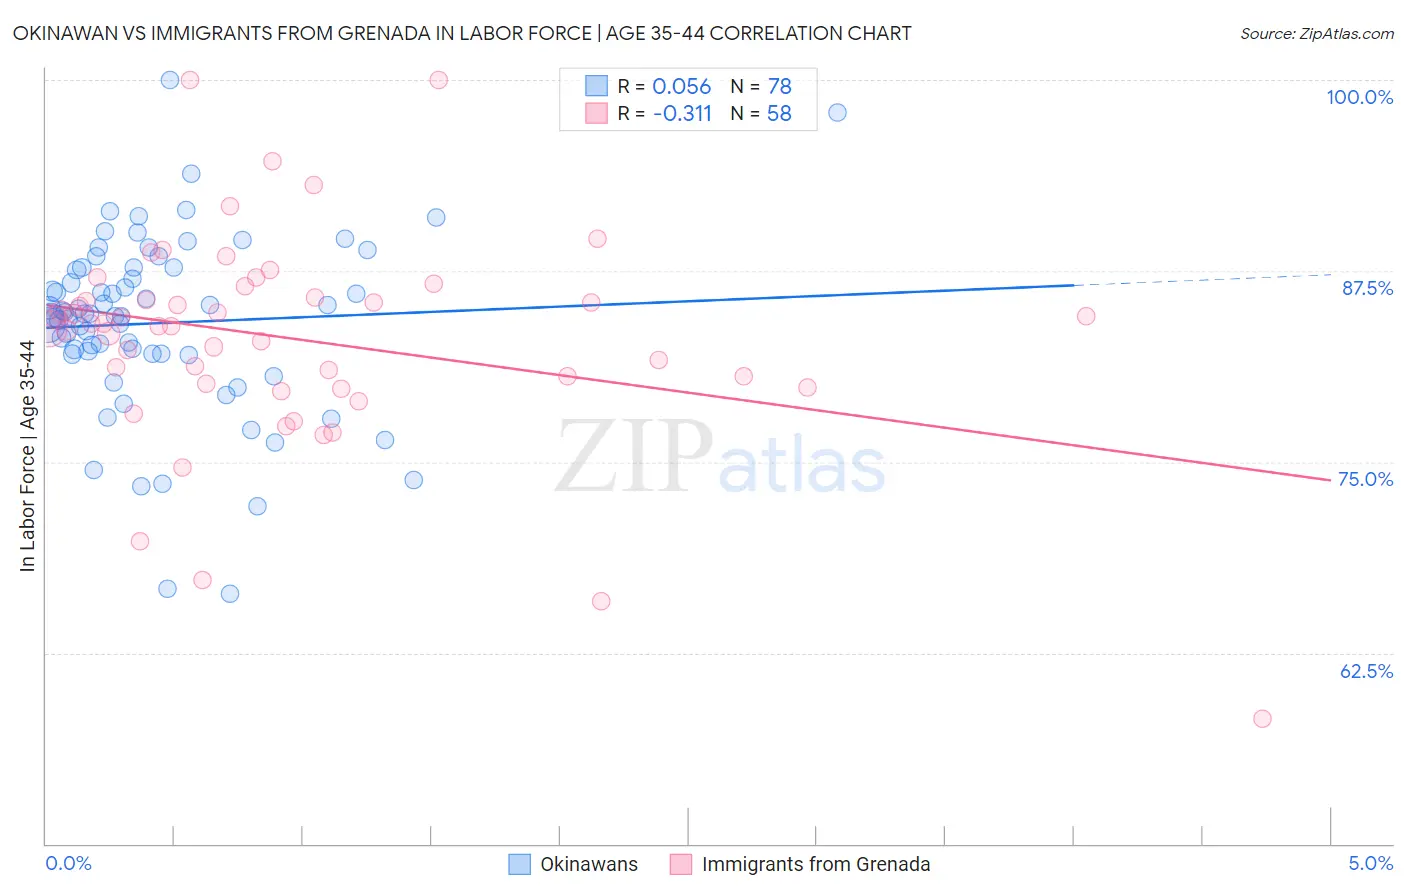
Okinawan vs Immigrants from Grenada In Labor Force | Age 35-44 Correlation Chart

The statistical analysis conducted on geographies consisting of 73,734,872 people shows a slight positive correlation between the proportion of Okinawans and labor force participation rate among population between the ages 35 and 44 in the United States with a correlation coefficient (R) of 0.056 and weighted average of 84.5%. Similarly, the statistical analysis conducted on geographies consisting of 67,194,907 people shows a mild negative correlation between the proportion of Immigrants from Grenada and labor force participation rate among population between the ages 35 and 44 in the United States with a correlation coefficient (R) of -0.311 and weighted average of 83.3%, a difference of 1.4%.
Okinawan vs Immigrants from Grenada In Labor Force | Age 35-44

In Labor Force | Age 35-44 Correlation Summary

MeasurementOkinawanImmigrants from Grenada
Minimum66.4%58.2%
Maximum100.0%100.0%
Range33.6%41.8%
Mean84.1%83.1%
Median84.6%84.0%
Interquartile 25% (IQ1)82.1%80.1%
Interquartile 75% (IQ3)87.7%85.8%
Interquartile Range (IQR)5.6%5.7%
Standard Deviation (Sample)5.9%7.0%
Standard Deviation (Population)5.9%7.0%

Similar Demographics by In Labor Force | Age 35-44

Demographics Similar to Okinawans by In Labor Force | Age 35-44

In terms of in labor force | age 35-44, the demographic groups most similar to Okinawans are South American Indian (84.5%, a difference of 0.0%), Immigrants from Nigeria (84.5%, a difference of 0.0%), Romanian (84.5%, a difference of 0.010%), Immigrants from Taiwan (84.5%, a difference of 0.020%), and Immigrants from Netherlands (84.5%, a difference of 0.030%).
DemographicsRating | RankIn Labor Force | Age 35-44
Immigrants | Uruguay
80.1
/100
|
#142
Excellent
84.6%
Immigrants | Ukraine
79.7
/100
|
#143
Good
84.6%
Immigrants | Jamaica
79.4
/100
|
#144
Good
84.6%
Immigrants | Saudi Arabia
79.4
/100
|
#145
Good
84.6%
Immigrants | Asia
78.7
/100
|
#146
Good
84.5%
Immigrants | Netherlands
76.6
/100
|
#147
Good
84.5%
South American Indians
73.6
/100
|
#148
Good
84.5%
Okinawans
73.5
/100
|
#149
Good
84.5%
Immigrants | Nigeria
73.3
/100
|
#150
Good
84.5%
Romanians
72.1
/100
|
#151
Good
84.5%
Immigrants | Taiwan
71.4
/100
|
#152
Good
84.5%
Trinidadians and Tobagonians
69.5
/100
|
#153
Good
84.5%
Iranians
69.4
/100
|
#154
Good
84.5%
Immigrants | Switzerland
65.9
/100
|
#155
Good
84.5%
Immigrants | Israel
64.3
/100
|
#156
Good
84.4%

Demographics Similar to Immigrants from Grenada by In Labor Force | Age 35-44

In terms of in labor force | age 35-44, the demographic groups most similar to Immigrants from Grenada are Honduran (83.4%, a difference of 0.010%), Guamanian/Chamorro (83.4%, a difference of 0.040%), Spaniard (83.4%, a difference of 0.090%), Immigrants from Honduras (83.3%, a difference of 0.12%), and French American Indian (83.2%, a difference of 0.12%).
DemographicsRating | RankIn Labor Force | Age 35-44
Immigrants | Congo
0.2
/100
|
#262
Tragic
83.5%
Iroquois
0.2
/100
|
#263
Tragic
83.5%
Scotch-Irish
0.1
/100
|
#264
Tragic
83.5%
Central Americans
0.1
/100
|
#265
Tragic
83.5%
Spaniards
0.1
/100
|
#266
Tragic
83.4%
Guamanians/Chamorros
0.1
/100
|
#267
Tragic
83.4%
Hondurans
0.1
/100
|
#268
Tragic
83.4%
Immigrants | Grenada
0.1
/100
|
#269
Tragic
83.3%
Immigrants | Honduras
0.0
/100
|
#270
Tragic
83.3%
French American Indians
0.0
/100
|
#271
Tragic
83.2%
Immigrants | Fiji
0.0
/100
|
#272
Tragic
83.2%
Spanish
0.0
/100
|
#273
Tragic
83.2%
Immigrants | Nonimmigrants
0.0
/100
|
#274
Tragic
83.2%
Hawaiians
0.0
/100
|
#275
Tragic
83.2%
Delaware
0.0
/100
|
#276
Tragic
83.2%