Immigrants from Scotland vs Colville In Labor Force | Age 35-44

COMPARE

Immigrants from Scotland
Race
Ancestry
AfghanAfricanAlaska NativeAlaskan AthabascanAlbanianAleutAlsatianAmericanApacheArabArapahoArgentineanArmenianAssyrian/Chaldean/SyriacAustralianAustrianBahamianBangladeshiBarbadianBasqueBelgianBelizeanBermudanBhutaneseBlackfeetBolivianBrazilianBritishBritish West IndianBulgarianBurmeseCajunCambodianCanadianCape VerdeanCarpatho RusynCelticCentral AmericanCentral American IndianCherokeeCheyenneChickasawChileanChineseChippewaChoctawColombianComancheCosta RicanCreeCreekCroatianCrowCubanCypriotCzechCzechoslovakianDanishDelawareDominicanDutchDutch West IndianEastern EuropeanEcuadorianEgyptianEnglishEstonianEthiopianEuropeanFijianFilipinoFinnishFrenchFrench American IndianFrench CanadianGermanGerman RussianGhanaianGreekGuamanian/ChamorroGuatemalanGuyaneseHaitianHmongHonduranHopiHoumaHungarianIcelanderIndian (Asian)IndonesianInupiatIranianIraqiIrishIroquoisIsraeliItalianJamaicanJapaneseJordanianKenyanKiowaKoreanLaotianLatvianLebaneseLiberianLithuanianLumbeeLuxembourgerMacedonianMalaysianMalteseMarshalleseMenomineeMexicanMexican American IndianMongolianMoroccanNative HawaiianNavajoNepaleseNew ZealanderNicaraguanNigerianNorthern EuropeanNorwegianOkinawanOsageOttawaPaiutePakistaniPalestinianPanamanianParaguayanPennsylvania GermanPeruvianPimaPolishPortuguesePotawatomiPuebloPuerto RicanPuget Sound SalishRomanianRussianSalvadoranSamoanScandinavianScotch-IrishScottishSeminoleSenegaleseSerbianShoshoneSierra LeoneanSiouxSlavicSlovakSloveneSomaliSouth AfricanSouth AmericanSouth American IndianSoviet UnionSpaniardSpanishSpanish AmericanSpanish American IndianSri LankanSubsaharan AfricanSudaneseSwedishSwissSyrianTaiwaneseThaiTlingit-HaidaTohono O'OdhamTonganTrinidadian and TobagonianTsimshianTurkishU.S. Virgin IslanderUgandanUkrainianUruguayanUteVenezuelanVietnameseWelshWest IndianYakamaYaquiYugoslavianYumanYup'ikZimbabwean
Immigration
NonimmigrantsImmigrantsAfghanistanAfricaAlbaniaArgentinaArmeniaAsiaAustraliaAustriaBahamasBangladeshBarbadosBelarusBelgiumBelizeBoliviaBosnia and HerzegovinaBrazilBulgariaBurma/MyanmarCabo VerdeCambodiaCameroonCanadaCaribbeanCentral AmericaChileChinaColombiaCongoCosta RicaCroatiaCubaCzechoslovakiaDenmarkDominicaDominican RepublicEastern AfricaEastern AsiaEastern EuropeEcuadorEgyptEl SalvadorEnglandEritreaEthiopiaEuropeFijiFranceGermanyGhanaGreeceGrenadaGuatemalaGuyanaHaitiHondurasHong KongHungaryIndiaIndonesiaIranIraqIrelandIsraelItalyJamaicaJapanJordanKazakhstanKenyaKoreaKuwaitLaosLatin AmericaLatviaLebanonLiberiaLithuaniaMalaysiaMexicoMicronesiaMiddle AfricaMoldovaMoroccoNepalNetherlandsNicaraguaNigeriaNorth AmericaNorth MacedoniaNorthern AfricaNorthern EuropeNorwayOceaniaPakistanPanamaPeruPhilippinesPolandPortugalRomaniaRussiaSaudi ArabiaScotlandSenegalSerbiaSierra LeoneSingaporeSomaliaSouth AfricaSouth AmericaSouth Central AsiaSouth Eastern AsiaSouthern EuropeSpainSri LankaSt. Vincent and the GrenadinesSudanSwedenSwitzerlandSyriaTaiwanThailandTrinidad and TobagoTurkeyUgandaUkraineUruguayUzbekistanVenezuelaVietnamWest IndiesWestern AfricaWestern AsiaWestern EuropeYemenZaireZimbabweAzores
Colville
Race
Ancestry
AfghanAfricanAlaska NativeAlaskan AthabascanAlbanianAleutAlsatianAmericanApacheArabArapahoArgentineanArmenianAssyrian/Chaldean/SyriacAustralianAustrianBahamianBangladeshiBarbadianBasqueBelgianBelizeanBermudanBhutaneseBlackfeetBolivianBrazilianBritishBritish West IndianBulgarianBurmeseCajunCambodianCanadianCape VerdeanCarpatho RusynCelticCentral AmericanCentral American IndianCherokeeCheyenneChickasawChileanChineseChippewaChoctawColombianColvilleComancheCosta RicanCreeCreekCroatianCrowCubanCypriotCzechCzechoslovakianDanishDelawareDominicanDutchDutch West IndianEastern EuropeanEcuadorianEgyptianEnglishEstonianEthiopianEuropeanFijianFilipinoFinnishFrenchFrench American IndianFrench CanadianGermanGerman RussianGhanaianGreekGuamanian/ChamorroGuatemalanGuyaneseHaitianHmongHonduranHopiHoumaHungarianIcelanderIndian (Asian)IndonesianInupiatIranianIraqiIrishIroquoisIsraeliItalianJamaicanJapaneseJordanianKenyanKiowaKoreanLaotianLatvianLebaneseLiberianLithuanianLumbeeLuxembourgerMacedonianMalaysianMalteseMarshalleseMenomineeMexicanMexican American IndianMongolianMoroccanNative HawaiianNavajoNepaleseNew ZealanderNicaraguanNigerianNorthern EuropeanNorwegianOkinawanOsageOttawaPaiutePakistaniPalestinianPanamanianParaguayanPennsylvania GermanPeruvianPimaPolishPortuguesePotawatomiPuebloPuerto RicanPuget Sound SalishRomanianRussianSalvadoranSamoanScandinavianScotch-IrishScottishSeminoleSenegaleseSerbianShoshoneSierra LeoneanSiouxSlavicSlovakSloveneSomaliSouth AfricanSouth AmericanSouth American IndianSoviet UnionSpaniardSpanishSpanish AmericanSpanish American IndianSri LankanSubsaharan AfricanSudaneseSwedishSwissSyrianTaiwaneseThaiTlingit-HaidaTohono O'OdhamTonganTrinidadian and TobagonianTsimshianTurkishU.S. Virgin IslanderUgandanUkrainianUruguayanUteVenezuelanVietnameseWelshWest IndianYakamaYaquiYugoslavianYumanYup'ikZimbabwean
Immigration
NonimmigrantsImmigrantsAfghanistanAfricaAlbaniaArgentinaArmeniaAsiaAustraliaAustriaBahamasBangladeshBarbadosBelarusBelgiumBelizeBoliviaBosnia and HerzegovinaBrazilBulgariaBurma/MyanmarCabo VerdeCambodiaCameroonCanadaCaribbeanCentral AmericaChileChinaColombiaCongoCosta RicaCroatiaCubaCzechoslovakiaDenmarkDominicaDominican RepublicEastern AfricaEastern AsiaEastern EuropeEcuadorEgyptEl SalvadorEnglandEritreaEthiopiaEuropeFijiFranceGermanyGhanaGreeceGrenadaGuatemalaGuyanaHaitiHondurasHong KongHungaryIndiaIndonesiaIranIraqIrelandIsraelItalyJamaicaJapanJordanKazakhstanKenyaKoreaKuwaitLaosLatin AmericaLatviaLebanonLiberiaLithuaniaMalaysiaMexicoMicronesiaMiddle AfricaMoldovaMoroccoNepalNetherlandsNicaraguaNigeriaNorth AmericaNorth MacedoniaNorthern AfricaNorthern EuropeNorwayOceaniaPakistanPanamaPeruPhilippinesPolandPortugalRomaniaRussiaSaudi ArabiaSenegalSerbiaSierra LeoneSingaporeSomaliaSouth AfricaSouth AmericaSouth Central AsiaSouth Eastern AsiaSouthern EuropeSpainSri LankaSt. Vincent and the GrenadinesSudanSwedenSwitzerlandSyriaTaiwanThailandTrinidad and TobagoTurkeyUgandaUkraineUruguayUzbekistanVenezuelaVietnamWest IndiesWestern AfricaWestern AsiaWestern EuropeYemenZaireZimbabweAzores
In Labor Force | Age 35-44
Income
Poverty
Unemployment
Labor Participation
Family Structure
Vehicle Availability
Education Level
Disability

In Labor Force | Age 35-44 Comparison

Immigrants from Scotland

Colville

Excellent
Tragic
84.7%
IN LABOR FORCE | AGE 35-44
89.6/ 100
METRIC RATING
131st/ 347
METRIC RANK
81.7%
IN LABOR FORCE | AGE 35-44
0.0/ 100
METRIC RATING
311th/ 347
METRIC RANK

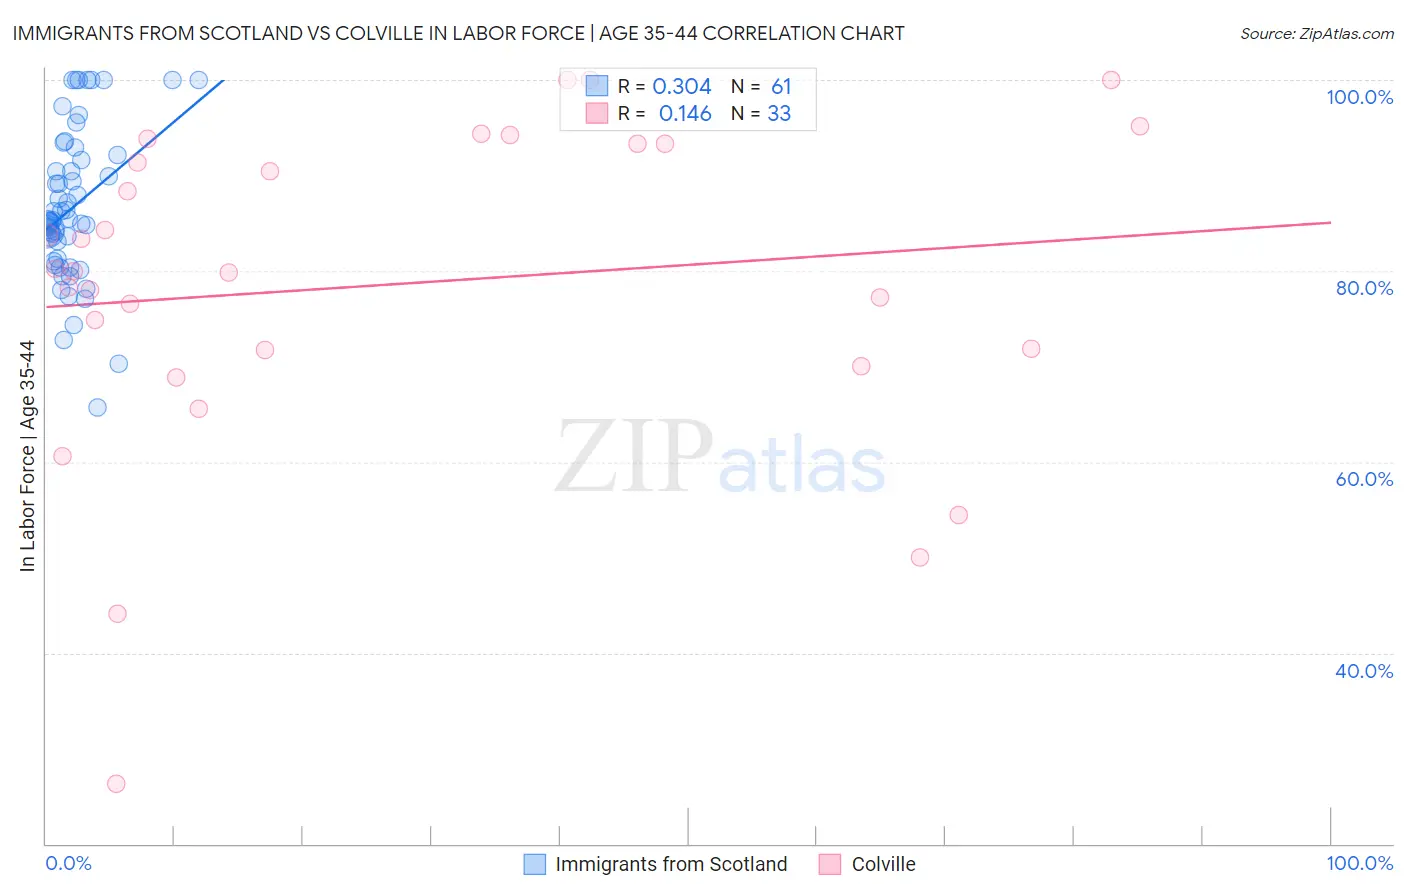
Immigrants from Scotland vs Colville In Labor Force | Age 35-44 Correlation Chart

The statistical analysis conducted on geographies consisting of 196,377,441 people shows a mild positive correlation between the proportion of Immigrants from Scotland and labor force participation rate among population between the ages 35 and 44 in the United States with a correlation coefficient (R) of 0.304 and weighted average of 84.7%. Similarly, the statistical analysis conducted on geographies consisting of 34,682,533 people shows a poor positive correlation between the proportion of Colville and labor force participation rate among population between the ages 35 and 44 in the United States with a correlation coefficient (R) of 0.146 and weighted average of 81.7%, a difference of 3.6%.
Immigrants from Scotland vs Colville In Labor Force | Age 35-44

In Labor Force | Age 35-44 Correlation Summary

MeasurementImmigrants from ScotlandColville
Minimum65.7%26.3%
Maximum100.0%100.0%
Range34.3%73.7%
Mean86.7%78.6%
Median85.1%79.9%
Interquartile 25% (IQ1)81.2%70.8%
Interquartile 75% (IQ3)91.9%93.3%
Interquartile Range (IQR)10.7%22.5%
Standard Deviation (Sample)7.9%17.1%
Standard Deviation (Population)7.8%16.9%

Similar Demographics by In Labor Force | Age 35-44

Demographics Similar to Immigrants from Scotland by In Labor Force | Age 35-44

In terms of in labor force | age 35-44, the demographic groups most similar to Immigrants from Scotland are Palestinian (84.7%, a difference of 0.0%), Bhutanese (84.7%, a difference of 0.0%), Austrian (84.7%, a difference of 0.0%), Immigrants from Ghana (84.7%, a difference of 0.010%), and Slavic (84.7%, a difference of 0.020%).
DemographicsRating | RankIn Labor Force | Age 35-44
Slavs
90.8
/100
|
#124
Exceptional
84.7%
Maltese
90.8
/100
|
#125
Exceptional
84.7%
Asians
90.6
/100
|
#126
Exceptional
84.7%
Immigrants | Spain
90.6
/100
|
#127
Exceptional
84.7%
Immigrants | Ghana
90.4
/100
|
#128
Exceptional
84.7%
Palestinians
89.7
/100
|
#129
Excellent
84.7%
Bhutanese
89.7
/100
|
#130
Excellent
84.7%
Immigrants | Scotland
89.6
/100
|
#131
Excellent
84.7%
Austrians
89.4
/100
|
#132
Excellent
84.7%
Argentineans
88.4
/100
|
#133
Excellent
84.6%
Immigrants | Korea
88.2
/100
|
#134
Excellent
84.6%
Immigrants | Malaysia
87.5
/100
|
#135
Excellent
84.6%
Afghans
86.3
/100
|
#136
Excellent
84.6%
Immigrants | Chile
84.6
/100
|
#137
Excellent
84.6%
Czechoslovakians
82.6
/100
|
#138
Excellent
84.6%

Demographics Similar to Colville by In Labor Force | Age 35-44

In terms of in labor force | age 35-44, the demographic groups most similar to Colville are Alaska Native (81.6%, a difference of 0.14%), Mexican (81.6%, a difference of 0.15%), Blackfeet (81.9%, a difference of 0.17%), Cajun (81.5%, a difference of 0.26%), and Immigrants from Mexico (81.5%, a difference of 0.28%).
DemographicsRating | RankIn Labor Force | Age 35-44
Marshallese
0.0
/100
|
#304
Tragic
82.4%
Shoshone
0.0
/100
|
#305
Tragic
82.2%
Blacks/African Americans
0.0
/100
|
#306
Tragic
82.2%
Hispanics or Latinos
0.0
/100
|
#307
Tragic
82.1%
Immigrants | Central America
0.0
/100
|
#308
Tragic
82.0%
Cree
0.0
/100
|
#309
Tragic
82.0%
Blackfeet
0.0
/100
|
#310
Tragic
81.9%
Colville
0.0
/100
|
#311
Tragic
81.7%
Alaska Natives
0.0
/100
|
#312
Tragic
81.6%
Mexicans
0.0
/100
|
#313
Tragic
81.6%
Cajuns
0.0
/100
|
#314
Tragic
81.5%
Immigrants | Mexico
0.0
/100
|
#315
Tragic
81.5%
Comanche
0.0
/100
|
#316
Tragic
81.5%
Cherokee
0.0
/100
|
#317
Tragic
81.4%
Alaskan Athabascans
0.0
/100
|
#318
Tragic
81.3%