African vs Colville In Labor Force | Age 35-44
COMPARE
African
Colville
In Labor Force | Age 35-44
In Labor Force | Age 35-44 Comparison
Africans
Colville
82.9%
IN LABOR FORCE | AGE 35-44
0.0/ 100
METRIC RATING
290th/ 347
METRIC RANK
81.7%
IN LABOR FORCE | AGE 35-44
0.0/ 100
METRIC RATING
311th/ 347
METRIC RANK
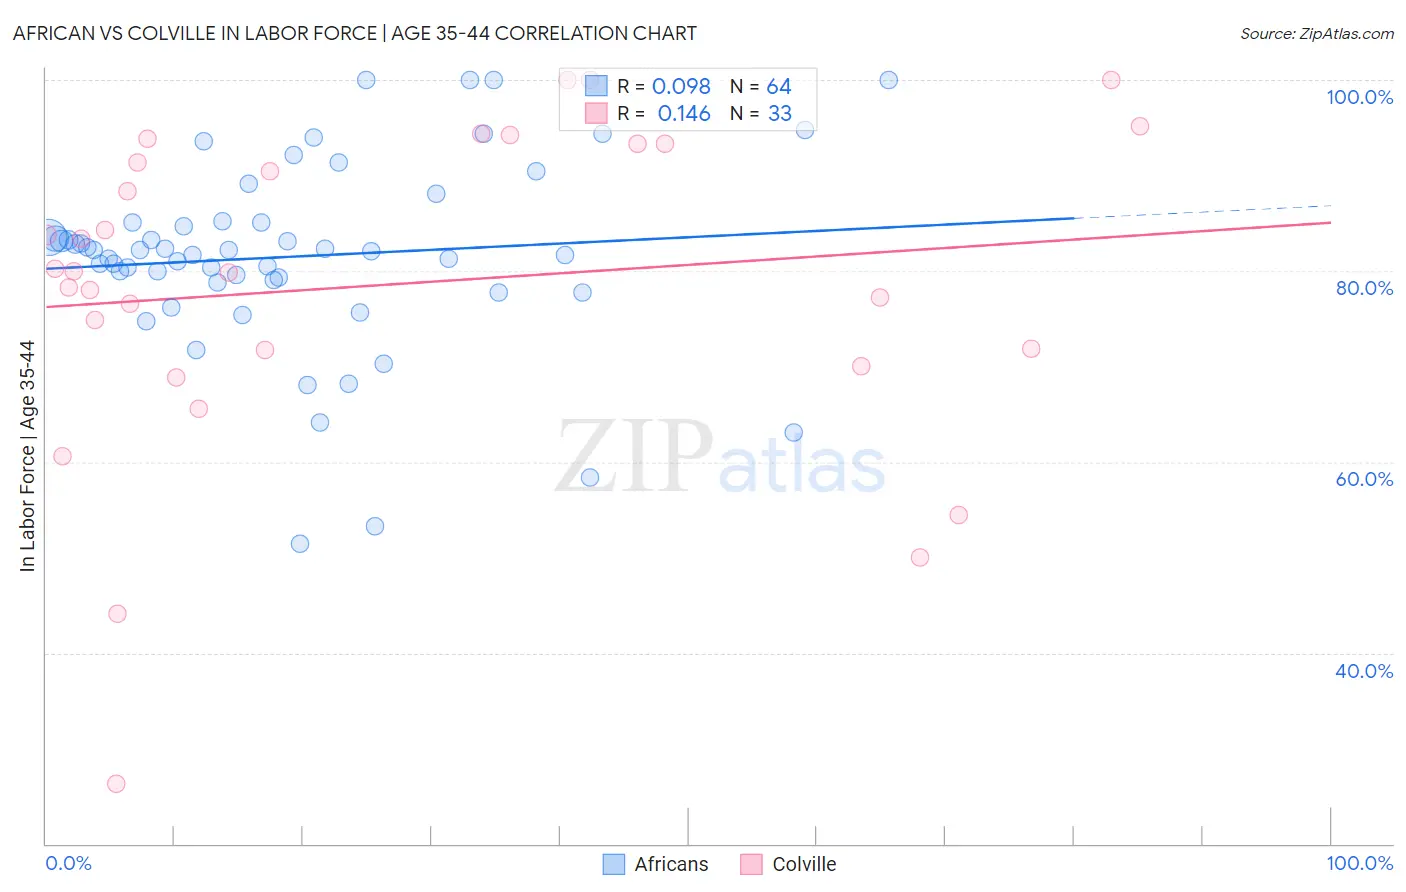
African vs Colville In Labor Force | Age 35-44 Correlation Chart
The statistical analysis conducted on geographies consisting of 469,704,956 people shows a slight positive correlation between the proportion of Africans and labor force participation rate among population between the ages 35 and 44 in the United States with a correlation coefficient (R) of 0.098 and weighted average of 82.9%. Similarly, the statistical analysis conducted on geographies consisting of 34,682,533 people shows a poor positive correlation between the proportion of Colville and labor force participation rate among population between the ages 35 and 44 in the United States with a correlation coefficient (R) of 0.146 and weighted average of 81.7%, a difference of 1.4%.
In Labor Force | Age 35-44 Correlation Summary
| Measurement | African | Colville |
| Minimum | 51.4% | 26.3% |
| Maximum | 100.0% | 100.0% |
| Range | 48.6% | 73.7% |
| Mean | 81.5% | 78.6% |
| Median | 82.1% | 79.9% |
| Interquartile 25% (IQ1) | 79.0% | 70.8% |
| Interquartile 75% (IQ3) | 85.1% | 93.3% |
| Interquartile Range (IQR) | 6.1% | 22.5% |
| Standard Deviation (Sample) | 10.0% | 17.1% |
| Standard Deviation (Population) | 9.9% | 16.9% |
Similar Demographics by In Labor Force | Age 35-44
Demographics Similar to Africans by In Labor Force | Age 35-44
In terms of in labor force | age 35-44, the demographic groups most similar to Africans are Chippewa (82.9%, a difference of 0.010%), Pennsylvania German (82.9%, a difference of 0.020%), Puget Sound Salish (82.9%, a difference of 0.030%), Immigrants from Belize (82.9%, a difference of 0.040%), and Fijian (82.9%, a difference of 0.050%).
| Demographics | Rating | Rank | In Labor Force | Age 35-44 |
| Immigrants | Guatemala | 0.0 /100 | #283 | Tragic 82.9% |
| Immigrants | Dominican Republic | 0.0 /100 | #284 | Tragic 82.9% |
| Fijians | 0.0 /100 | #285 | Tragic 82.9% |
| Immigrants | Bangladesh | 0.0 /100 | #286 | Tragic 82.9% |
| Immigrants | Belize | 0.0 /100 | #287 | Tragic 82.9% |
| Puget Sound Salish | 0.0 /100 | #288 | Tragic 82.9% |
| Chippewa | 0.0 /100 | #289 | Tragic 82.9% |
| Africans | 0.0 /100 | #290 | Tragic 82.9% |
| Pennsylvania Germans | 0.0 /100 | #291 | Tragic 82.9% |
| Immigrants | Latin America | 0.0 /100 | #292 | Tragic 82.8% |
| Spanish Americans | 0.0 /100 | #293 | Tragic 82.8% |
| Potawatomi | 0.0 /100 | #294 | Tragic 82.7% |
| Immigrants | Lebanon | 0.0 /100 | #295 | Tragic 82.7% |
| Mexican American Indians | 0.0 /100 | #296 | Tragic 82.6% |
| Hmong | 0.0 /100 | #297 | Tragic 82.6% |
Demographics Similar to Colville by In Labor Force | Age 35-44
In terms of in labor force | age 35-44, the demographic groups most similar to Colville are Alaska Native (81.6%, a difference of 0.14%), Mexican (81.6%, a difference of 0.15%), Blackfeet (81.9%, a difference of 0.17%), Cajun (81.5%, a difference of 0.26%), and Immigrants from Mexico (81.5%, a difference of 0.28%).
| Demographics | Rating | Rank | In Labor Force | Age 35-44 |
| Marshallese | 0.0 /100 | #304 | Tragic 82.4% |
| Shoshone | 0.0 /100 | #305 | Tragic 82.2% |
| Blacks/African Americans | 0.0 /100 | #306 | Tragic 82.2% |
| Hispanics or Latinos | 0.0 /100 | #307 | Tragic 82.1% |
| Immigrants | Central America | 0.0 /100 | #308 | Tragic 82.0% |
| Cree | 0.0 /100 | #309 | Tragic 82.0% |
| Blackfeet | 0.0 /100 | #310 | Tragic 81.9% |
| Colville | 0.0 /100 | #311 | Tragic 81.7% |
| Alaska Natives | 0.0 /100 | #312 | Tragic 81.6% |
| Mexicans | 0.0 /100 | #313 | Tragic 81.6% |
| Cajuns | 0.0 /100 | #314 | Tragic 81.5% |
| Immigrants | Mexico | 0.0 /100 | #315 | Tragic 81.5% |
| Comanche | 0.0 /100 | #316 | Tragic 81.5% |
| Cherokee | 0.0 /100 | #317 | Tragic 81.4% |
| Alaskan Athabascans | 0.0 /100 | #318 | Tragic 81.3% |