Immigrants from Russia vs Yup'ik In Labor Force | Age 16-19
COMPARE
Immigrants from Russia
Yup'ik
In Labor Force | Age 16-19
In Labor Force | Age 16-19 Comparison
Immigrants from Russia
Yup'ik
34.1%
IN LABOR FORCE | AGE 16-19
0.4/ 100
METRIC RATING
270th/ 347
METRIC RANK
33.3%
IN LABOR FORCE | AGE 16-19
0.1/ 100
METRIC RATING
295th/ 347
METRIC RANK
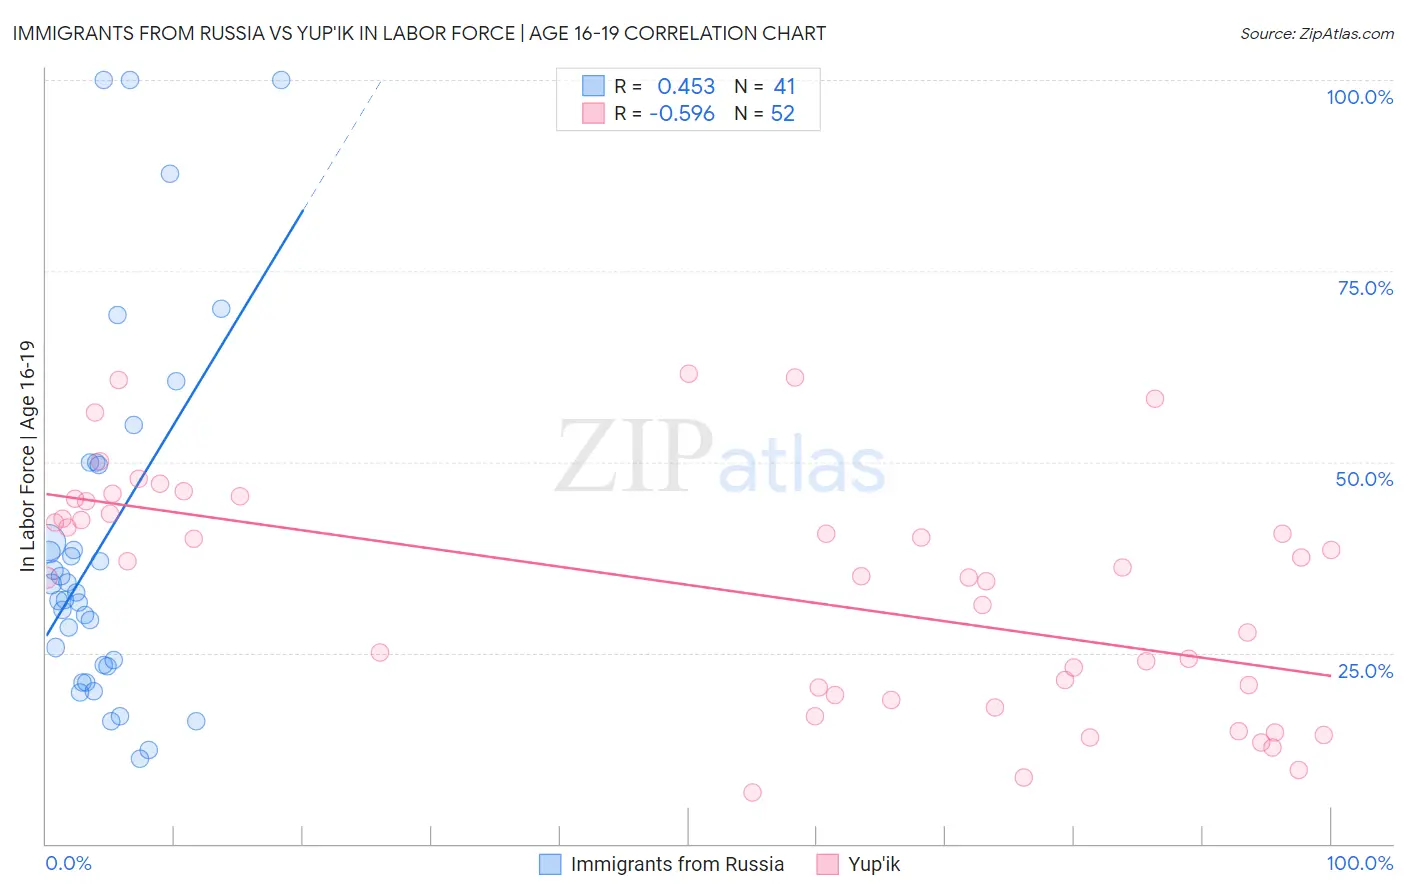
Immigrants from Russia vs Yup'ik In Labor Force | Age 16-19 Correlation Chart
The statistical analysis conducted on geographies consisting of 347,439,829 people shows a moderate positive correlation between the proportion of Immigrants from Russia and labor force participation rate among population between the ages 16 and 19 in the United States with a correlation coefficient (R) of 0.453 and weighted average of 34.1%. Similarly, the statistical analysis conducted on geographies consisting of 39,923,752 people shows a substantial negative correlation between the proportion of Yup'ik and labor force participation rate among population between the ages 16 and 19 in the United States with a correlation coefficient (R) of -0.596 and weighted average of 33.3%, a difference of 2.5%.
In Labor Force | Age 16-19 Correlation Summary
| Measurement | Immigrants from Russia | Yup'ik |
| Minimum | 11.2% | 6.7% |
| Maximum | 100.0% | 61.5% |
| Range | 88.8% | 54.8% |
| Mean | 39.5% | 33.3% |
| Median | 32.9% | 35.5% |
| Interquartile 25% (IQ1) | 23.3% | 19.9% |
| Interquartile 75% (IQ3) | 49.7% | 44.0% |
| Interquartile Range (IQR) | 26.4% | 24.1% |
| Standard Deviation (Sample) | 23.7% | 15.0% |
| Standard Deviation (Population) | 23.4% | 14.9% |
Similar Demographics by In Labor Force | Age 16-19
Demographics Similar to Immigrants from Russia by In Labor Force | Age 16-19
In terms of in labor force | age 16-19, the demographic groups most similar to Immigrants from Russia are Central American Indian (34.1%, a difference of 0.0%), Asian (34.1%, a difference of 0.030%), Pima (34.1%, a difference of 0.050%), Immigrants from Asia (34.1%, a difference of 0.13%), and Immigrants from Panama (34.0%, a difference of 0.24%).
| Demographics | Rating | Rank | In Labor Force | Age 16-19 |
| Burmese | 1.1 /100 | #263 | Tragic 34.5% |
| Immigrants | Uruguay | 0.9 /100 | #264 | Tragic 34.4% |
| Immigrants | El Salvador | 0.7 /100 | #265 | Tragic 34.3% |
| Immigrants | Malaysia | 0.7 /100 | #266 | Tragic 34.3% |
| Immigrants | Peru | 0.5 /100 | #267 | Tragic 34.2% |
| Immigrants | Asia | 0.5 /100 | #268 | Tragic 34.1% |
| Pima | 0.5 /100 | #269 | Tragic 34.1% |
| Immigrants | Russia | 0.4 /100 | #270 | Tragic 34.1% |
| Central American Indians | 0.4 /100 | #271 | Tragic 34.1% |
| Asians | 0.4 /100 | #272 | Tragic 34.1% |
| Immigrants | Panama | 0.4 /100 | #273 | Tragic 34.0% |
| Venezuelans | 0.3 /100 | #274 | Tragic 34.0% |
| Immigrants | Fiji | 0.3 /100 | #275 | Tragic 33.9% |
| Immigrants | Latin America | 0.3 /100 | #276 | Tragic 33.9% |
| Menominee | 0.3 /100 | #277 | Tragic 33.9% |
Demographics Similar to Yup'ik by In Labor Force | Age 16-19
In terms of in labor force | age 16-19, the demographic groups most similar to Yup'ik are Argentinean (33.3%, a difference of 0.10%), Immigrants from South America (33.3%, a difference of 0.12%), Jamaican (33.2%, a difference of 0.13%), Immigrants from Haiti (33.2%, a difference of 0.22%), and Haitian (33.4%, a difference of 0.44%).
| Demographics | Rating | Rank | In Labor Force | Age 16-19 |
| Immigrants | Indonesia | 0.1 /100 | #288 | Tragic 33.5% |
| Immigrants | Singapore | 0.1 /100 | #289 | Tragic 33.5% |
| Immigrants | Colombia | 0.1 /100 | #290 | Tragic 33.5% |
| Immigrants | Belarus | 0.1 /100 | #291 | Tragic 33.4% |
| Haitians | 0.1 /100 | #292 | Tragic 33.4% |
| Immigrants | South America | 0.1 /100 | #293 | Tragic 33.3% |
| Argentineans | 0.1 /100 | #294 | Tragic 33.3% |
| Yup'ik | 0.1 /100 | #295 | Tragic 33.3% |
| Jamaicans | 0.1 /100 | #296 | Tragic 33.2% |
| Immigrants | Haiti | 0.1 /100 | #297 | Tragic 33.2% |
| Iranians | 0.0 /100 | #298 | Tragic 33.0% |
| Armenians | 0.0 /100 | #299 | Tragic 32.9% |
| Immigrants | Argentina | 0.0 /100 | #300 | Tragic 32.9% |
| Okinawans | 0.0 /100 | #301 | Tragic 32.8% |
| Belizeans | 0.0 /100 | #302 | Tragic 32.8% |