Immigrants from Russia vs Yup'ik Nursery School
COMPARE
Immigrants from Russia
Yup'ik
Nursery School
Nursery School Comparison
Immigrants from Russia
Yup'ik
98.0%
NURSERY SCHOOL
59.9/ 100
METRIC RATING
160th/ 347
METRIC RANK
99.2%
NURSERY SCHOOL
100.0/ 100
METRIC RATING
2nd/ 347
METRIC RANK
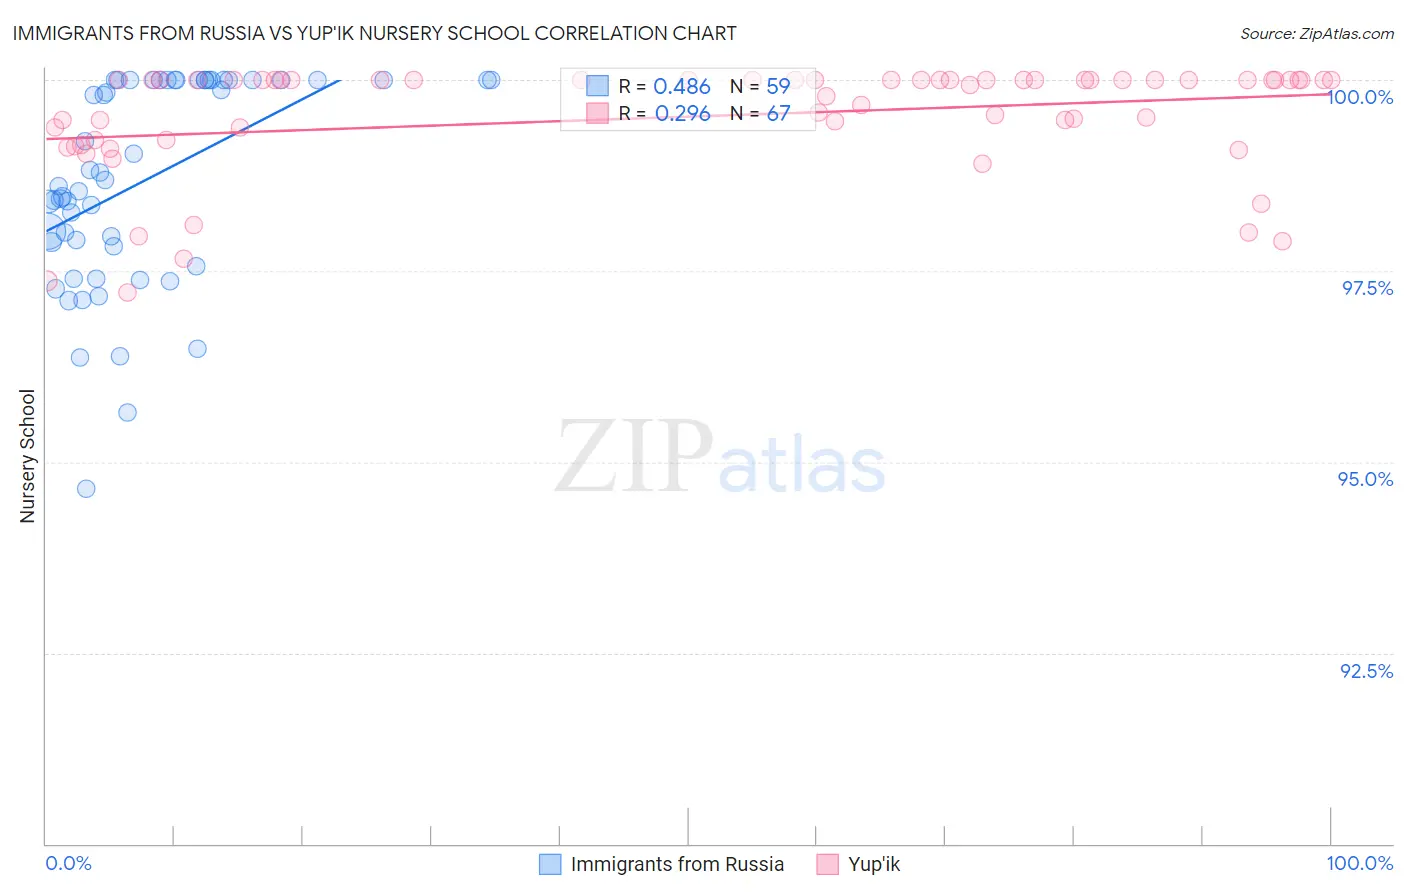
Immigrants from Russia vs Yup'ik Nursery School Correlation Chart
The statistical analysis conducted on geographies consisting of 347,948,494 people shows a moderate positive correlation between the proportion of Immigrants from Russia and percentage of population with at least nursery school education in the United States with a correlation coefficient (R) of 0.486 and weighted average of 98.0%. Similarly, the statistical analysis conducted on geographies consisting of 39,964,464 people shows a weak positive correlation between the proportion of Yup'ik and percentage of population with at least nursery school education in the United States with a correlation coefficient (R) of 0.296 and weighted average of 99.2%, a difference of 1.2%.
Nursery School Correlation Summary
| Measurement | Immigrants from Russia | Yup'ik |
| Minimum | 94.6% | 97.2% |
| Maximum | 100.0% | 100.0% |
| Range | 5.4% | 2.8% |
| Mean | 98.7% | 99.5% |
| Median | 98.7% | 100.0% |
| Interquartile 25% (IQ1) | 97.8% | 99.2% |
| Interquartile 75% (IQ3) | 100.0% | 100.0% |
| Interquartile Range (IQR) | 2.2% | 0.78% |
| Standard Deviation (Sample) | 1.3% | 0.72% |
| Standard Deviation (Population) | 1.3% | 0.72% |
Similar Demographics by Nursery School
Demographics Similar to Immigrants from Russia by Nursery School
In terms of nursery school, the demographic groups most similar to Immigrants from Russia are Immigrants from Eastern Europe (98.0%, a difference of 0.0%), Brazilian (98.0%, a difference of 0.0%), Immigrants from Italy (98.0%, a difference of 0.0%), French American Indian (98.0%, a difference of 0.010%), and Ugandan (98.0%, a difference of 0.010%).
| Demographics | Rating | Rank | Nursery School |
| Immigrants | Moldova | 69.6 /100 | #153 | Good 98.0% |
| Immigrants | Iran | 68.7 /100 | #154 | Good 98.0% |
| Immigrants | South Central Asia | 66.7 /100 | #155 | Good 98.0% |
| Venezuelans | 66.6 /100 | #156 | Good 98.0% |
| Comanche | 66.0 /100 | #157 | Good 98.0% |
| Immigrants | North Macedonia | 65.7 /100 | #158 | Good 98.0% |
| French American Indians | 62.1 /100 | #159 | Good 98.0% |
| Immigrants | Russia | 59.9 /100 | #160 | Average 98.0% |
| Immigrants | Eastern Europe | 59.7 /100 | #161 | Average 98.0% |
| Brazilians | 59.4 /100 | #162 | Average 98.0% |
| Immigrants | Italy | 59.0 /100 | #163 | Average 98.0% |
| Ugandans | 56.4 /100 | #164 | Average 98.0% |
| Chileans | 56.4 /100 | #165 | Average 98.0% |
| Spanish Americans | 55.6 /100 | #166 | Average 98.0% |
| Immigrants | Spain | 55.6 /100 | #167 | Average 98.0% |
Demographics Similar to Yup'ik by Nursery School
In terms of nursery school, the demographic groups most similar to Yup'ik are Welsh (98.9%, a difference of 0.33%), Inupiat (98.9%, a difference of 0.33%), Tsimshian (98.9%, a difference of 0.36%), Alaskan Athabascan (98.8%, a difference of 0.42%), and Crow (99.7%, a difference of 0.44%).
| Demographics | Rating | Rank | Nursery School |
| Crow | 100.0 /100 | #1 | Exceptional 99.7% |
| Yup'ik | 100.0 /100 | #2 | Exceptional 99.2% |
| Welsh | 100.0 /100 | #3 | Exceptional 98.9% |
| Inupiat | 100.0 /100 | #4 | Exceptional 98.9% |
| Tsimshian | 100.0 /100 | #5 | Exceptional 98.9% |
| Alaskan Athabascans | 100.0 /100 | #6 | Exceptional 98.8% |
| Alaska Natives | 100.0 /100 | #7 | Exceptional 98.8% |
| Norwegians | 100.0 /100 | #8 | Exceptional 98.7% |
| Slovaks | 100.0 /100 | #9 | Exceptional 98.7% |
| Germans | 100.0 /100 | #10 | Exceptional 98.7% |
| Tlingit-Haida | 100.0 /100 | #11 | Exceptional 98.7% |
| Slovenes | 100.0 /100 | #12 | Exceptional 98.7% |
| English | 100.0 /100 | #13 | Exceptional 98.7% |
| Carpatho Rusyns | 100.0 /100 | #14 | Exceptional 98.7% |
| Swedes | 100.0 /100 | #15 | Exceptional 98.7% |