Immigrants from Pakistan vs Nigerian In Labor Force | Age 45-54
COMPARE
Immigrants from Pakistan
Nigerian
In Labor Force | Age 45-54
In Labor Force | Age 45-54 Comparison
Immigrants from Pakistan
Nigerians
83.8%
IN LABOR FORCE | AGE 45-54
99.7/ 100
METRIC RATING
29th/ 347
METRIC RANK
82.7%
IN LABOR FORCE | AGE 45-54
40.5/ 100
METRIC RATING
178th/ 347
METRIC RANK
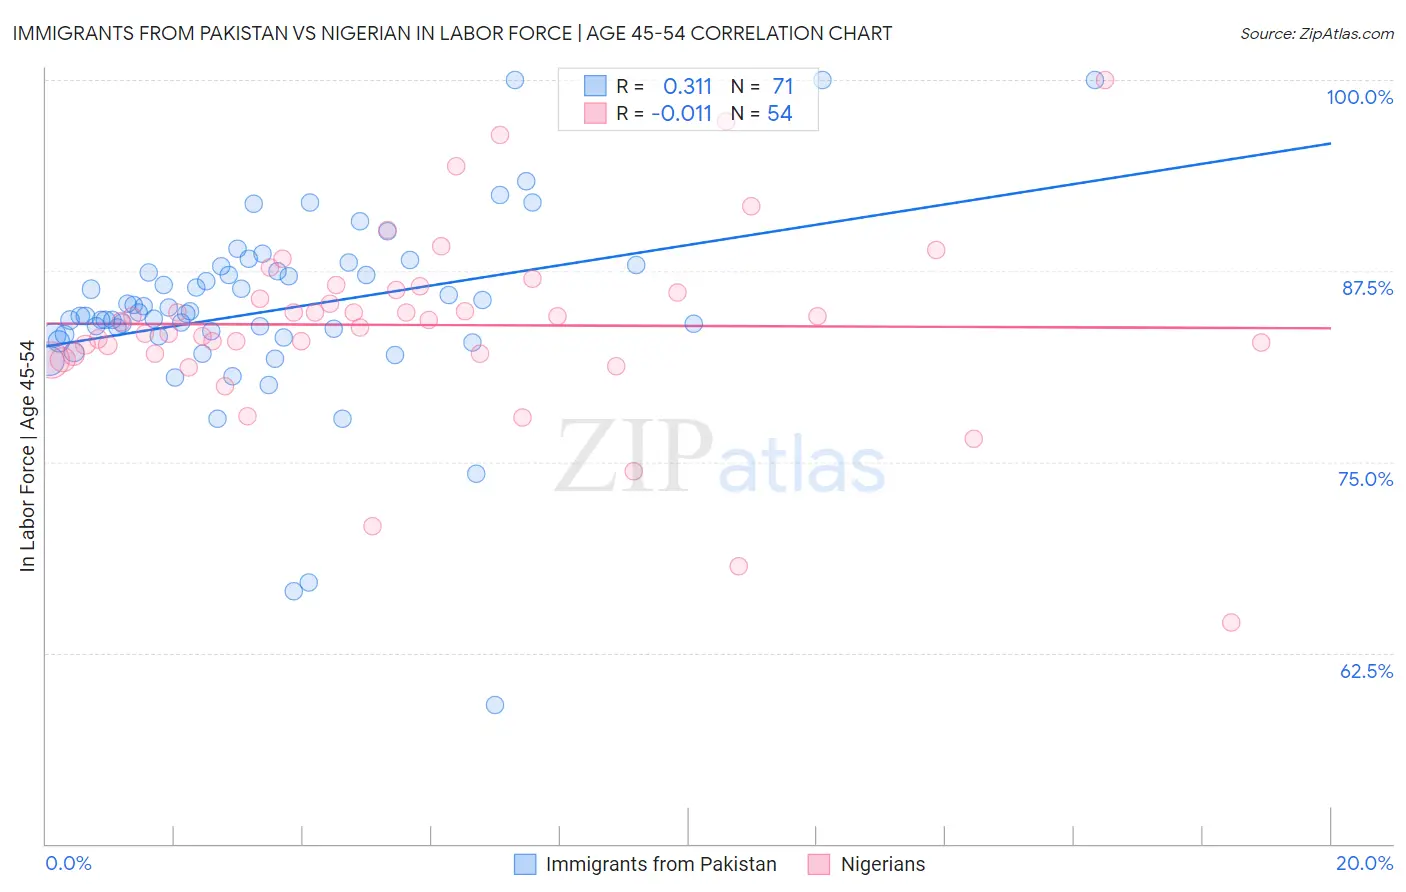
Immigrants from Pakistan vs Nigerian In Labor Force | Age 45-54 Correlation Chart
The statistical analysis conducted on geographies consisting of 283,776,614 people shows a mild positive correlation between the proportion of Immigrants from Pakistan and labor force participation rate among population between the ages 45 and 54 in the United States with a correlation coefficient (R) of 0.311 and weighted average of 83.8%. Similarly, the statistical analysis conducted on geographies consisting of 332,454,323 people shows no correlation between the proportion of Nigerians and labor force participation rate among population between the ages 45 and 54 in the United States with a correlation coefficient (R) of -0.011 and weighted average of 82.7%, a difference of 1.4%.
In Labor Force | Age 45-54 Correlation Summary
| Measurement | Immigrants from Pakistan | Nigerian |
| Minimum | 59.1% | 64.5% |
| Maximum | 100.0% | 100.0% |
| Range | 40.9% | 35.5% |
| Mean | 84.9% | 84.0% |
| Median | 84.7% | 84.2% |
| Interquartile 25% (IQ1) | 83.2% | 82.1% |
| Interquartile 75% (IQ3) | 87.5% | 86.2% |
| Interquartile Range (IQR) | 4.3% | 4.2% |
| Standard Deviation (Sample) | 6.3% | 6.2% |
| Standard Deviation (Population) | 6.3% | 6.1% |
Similar Demographics by In Labor Force | Age 45-54
Demographics Similar to Immigrants from Pakistan by In Labor Force | Age 45-54
In terms of in labor force | age 45-54, the demographic groups most similar to Immigrants from Pakistan are Immigrants from Lithuania (83.9%, a difference of 0.020%), Immigrants from Brazil (83.9%, a difference of 0.030%), Immigrants from Bulgaria (83.8%, a difference of 0.030%), Immigrants from Serbia (83.9%, a difference of 0.040%), and Immigrants from North Macedonia (83.9%, a difference of 0.050%).
| Demographics | Rating | Rank | In Labor Force | Age 45-54 |
| Immigrants | Ireland | 99.8 /100 | #22 | Exceptional 83.9% |
| Tlingit-Haida | 99.8 /100 | #23 | Exceptional 83.9% |
| Slovenes | 99.8 /100 | #24 | Exceptional 83.9% |
| Immigrants | North Macedonia | 99.8 /100 | #25 | Exceptional 83.9% |
| Immigrants | Serbia | 99.8 /100 | #26 | Exceptional 83.9% |
| Immigrants | Brazil | 99.8 /100 | #27 | Exceptional 83.9% |
| Immigrants | Lithuania | 99.8 /100 | #28 | Exceptional 83.9% |
| Immigrants | Pakistan | 99.7 /100 | #29 | Exceptional 83.8% |
| Immigrants | Bulgaria | 99.7 /100 | #30 | Exceptional 83.8% |
| Immigrants | Eritrea | 99.7 /100 | #31 | Exceptional 83.8% |
| Turks | 99.7 /100 | #32 | Exceptional 83.8% |
| Latvians | 99.7 /100 | #33 | Exceptional 83.8% |
| Kenyans | 99.5 /100 | #34 | Exceptional 83.7% |
| Brazilians | 99.5 /100 | #35 | Exceptional 83.7% |
| Ugandans | 99.5 /100 | #36 | Exceptional 83.7% |
Demographics Similar to Nigerians by In Labor Force | Age 45-54
In terms of in labor force | age 45-54, the demographic groups most similar to Nigerians are Immigrants from Switzerland (82.7%, a difference of 0.010%), Hungarian (82.7%, a difference of 0.020%), Israeli (82.7%, a difference of 0.030%), Immigrants from Hungary (82.7%, a difference of 0.030%), and Immigrants from Nicaragua (82.7%, a difference of 0.040%).
| Demographics | Rating | Rank | In Labor Force | Age 45-54 |
| Immigrants | Zaire | 52.9 /100 | #171 | Average 82.8% |
| Icelanders | 51.8 /100 | #172 | Average 82.8% |
| Nicaraguans | 50.3 /100 | #173 | Average 82.8% |
| Costa Ricans | 50.0 /100 | #174 | Average 82.8% |
| Immigrants | Liberia | 47.9 /100 | #175 | Average 82.7% |
| Northern Europeans | 46.9 /100 | #176 | Average 82.7% |
| Immigrants | Nicaragua | 44.6 /100 | #177 | Average 82.7% |
| Nigerians | 40.5 /100 | #178 | Average 82.7% |
| Immigrants | Switzerland | 39.4 /100 | #179 | Fair 82.7% |
| Hungarians | 38.0 /100 | #180 | Fair 82.7% |
| Israelis | 37.7 /100 | #181 | Fair 82.7% |
| Immigrants | Hungary | 37.1 /100 | #182 | Fair 82.7% |
| New Zealanders | 32.7 /100 | #183 | Fair 82.6% |
| Europeans | 32.6 /100 | #184 | Fair 82.6% |
| Immigrants | England | 32.2 /100 | #185 | Fair 82.6% |