Crow vs Immigrants from South America In Labor Force | Age 25-29
COMPARE
Crow
Immigrants from South America
In Labor Force | Age 25-29
In Labor Force | Age 25-29 Comparison
Crow
Immigrants from South America
78.6%
IN LABOR FORCE | AGE 25-29
0.0/ 100
METRIC RATING
337th/ 347
METRIC RANK
84.6%
IN LABOR FORCE | AGE 25-29
42.9/ 100
METRIC RATING
180th/ 347
METRIC RANK
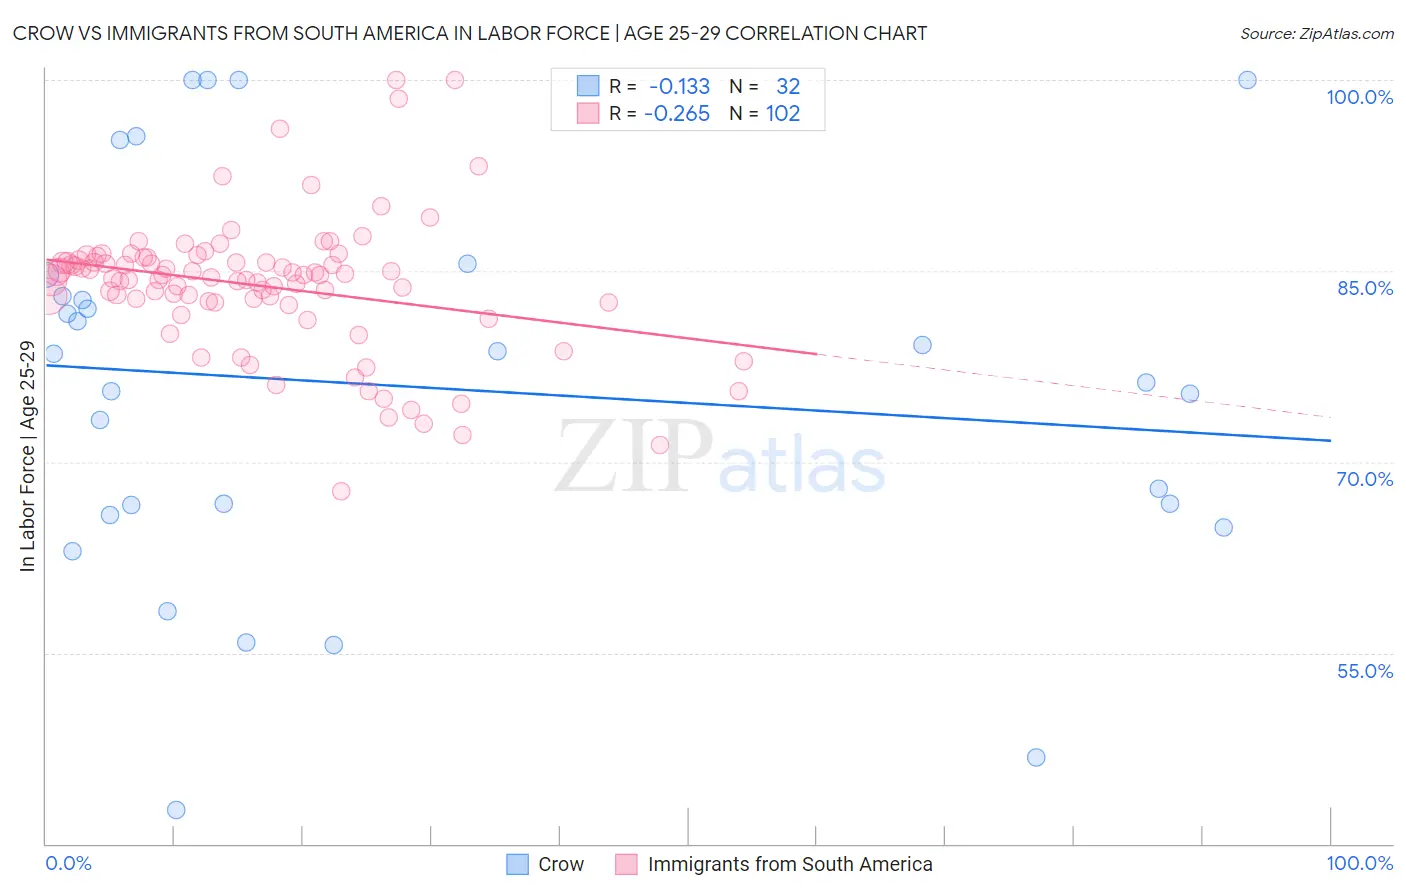
Crow vs Immigrants from South America In Labor Force | Age 25-29 Correlation Chart
The statistical analysis conducted on geographies consisting of 59,193,680 people shows a poor negative correlation between the proportion of Crow and labor force participation rate among population between the ages 25 and 29 in the United States with a correlation coefficient (R) of -0.133 and weighted average of 78.6%. Similarly, the statistical analysis conducted on geographies consisting of 486,086,715 people shows a weak negative correlation between the proportion of Immigrants from South America and labor force participation rate among population between the ages 25 and 29 in the United States with a correlation coefficient (R) of -0.265 and weighted average of 84.6%, a difference of 7.6%.
In Labor Force | Age 25-29 Correlation Summary
| Measurement | Crow | Immigrants from South America |
| Minimum | 42.7% | 67.7% |
| Maximum | 100.0% | 100.0% |
| Range | 57.3% | 32.3% |
| Mean | 75.9% | 83.8% |
| Median | 77.3% | 84.6% |
| Interquartile 25% (IQ1) | 66.2% | 82.5% |
| Interquartile 75% (IQ3) | 83.9% | 85.9% |
| Interquartile Range (IQR) | 17.6% | 3.4% |
| Standard Deviation (Sample) | 15.3% | 5.4% |
| Standard Deviation (Population) | 15.1% | 5.4% |
Similar Demographics by In Labor Force | Age 25-29
Demographics Similar to Crow by In Labor Force | Age 25-29
In terms of in labor force | age 25-29, the demographic groups most similar to Crow are Lumbee (78.3%, a difference of 0.37%), Immigrants from Yemen (78.2%, a difference of 0.49%), Paiute (78.1%, a difference of 0.65%), Apache (79.2%, a difference of 0.76%), and Native/Alaskan (79.3%, a difference of 0.83%).
| Demographics | Rating | Rank | In Labor Force | Age 25-29 |
| Puerto Ricans | 0.0 /100 | #330 | Tragic 80.4% |
| Cheyenne | 0.0 /100 | #331 | Tragic 80.3% |
| Inupiat | 0.0 /100 | #332 | Tragic 79.8% |
| Sioux | 0.0 /100 | #333 | Tragic 79.7% |
| Yuman | 0.0 /100 | #334 | Tragic 79.3% |
| Natives/Alaskans | 0.0 /100 | #335 | Tragic 79.3% |
| Apache | 0.0 /100 | #336 | Tragic 79.2% |
| Crow | 0.0 /100 | #337 | Tragic 78.6% |
| Lumbee | 0.0 /100 | #338 | Tragic 78.3% |
| Immigrants | Yemen | 0.0 /100 | #339 | Tragic 78.2% |
| Paiute | 0.0 /100 | #340 | Tragic 78.1% |
| Tohono O'odham | 0.0 /100 | #341 | Tragic 77.5% |
| Pueblo | 0.0 /100 | #342 | Tragic 77.5% |
| Arapaho | 0.0 /100 | #343 | Tragic 76.6% |
| Hopi | 0.0 /100 | #344 | Tragic 76.5% |
Demographics Similar to Immigrants from South America by In Labor Force | Age 25-29
In terms of in labor force | age 25-29, the demographic groups most similar to Immigrants from South America are Immigrants from Argentina (84.6%, a difference of 0.010%), Immigrants from Norway (84.6%, a difference of 0.010%), Immigrants from China (84.6%, a difference of 0.020%), Immigrants from Thailand (84.6%, a difference of 0.020%), and European (84.6%, a difference of 0.020%).
| Demographics | Rating | Rank | In Labor Force | Age 25-29 |
| Assyrians/Chaldeans/Syriacs | 50.2 /100 | #173 | Average 84.7% |
| Palestinians | 50.0 /100 | #174 | Average 84.7% |
| Hungarians | 47.8 /100 | #175 | Average 84.6% |
| Malaysians | 46.8 /100 | #176 | Average 84.6% |
| Immigrants | China | 45.7 /100 | #177 | Average 84.6% |
| Immigrants | Thailand | 45.2 /100 | #178 | Average 84.6% |
| Immigrants | Argentina | 44.0 /100 | #179 | Average 84.6% |
| Immigrants | South America | 42.9 /100 | #180 | Average 84.6% |
| Immigrants | Norway | 41.9 /100 | #181 | Average 84.6% |
| Europeans | 40.3 /100 | #182 | Average 84.6% |
| Scottish | 40.1 /100 | #183 | Average 84.6% |
| Immigrants | Kuwait | 38.2 /100 | #184 | Fair 84.6% |
| Immigrants | Denmark | 37.0 /100 | #185 | Fair 84.6% |
| Immigrants | Belgium | 35.0 /100 | #186 | Fair 84.6% |
| Immigrants | Portugal | 34.7 /100 | #187 | Fair 84.6% |