Immigrants from Northern Europe vs Immigrants from Netherlands Births to Unmarried Women
COMPARE
Immigrants from Northern Europe
Immigrants from Netherlands
Births to Unmarried Women
Births to Unmarried Women Comparison
Immigrants from Northern Europe
Immigrants from Netherlands
28.6%
BIRTHS TO UNMARRIED WOMEN
98.3/ 100
METRIC RATING
77th/ 347
METRIC RANK
29.9%
BIRTHS TO UNMARRIED WOMEN
91.1/ 100
METRIC RATING
117th/ 347
METRIC RANK
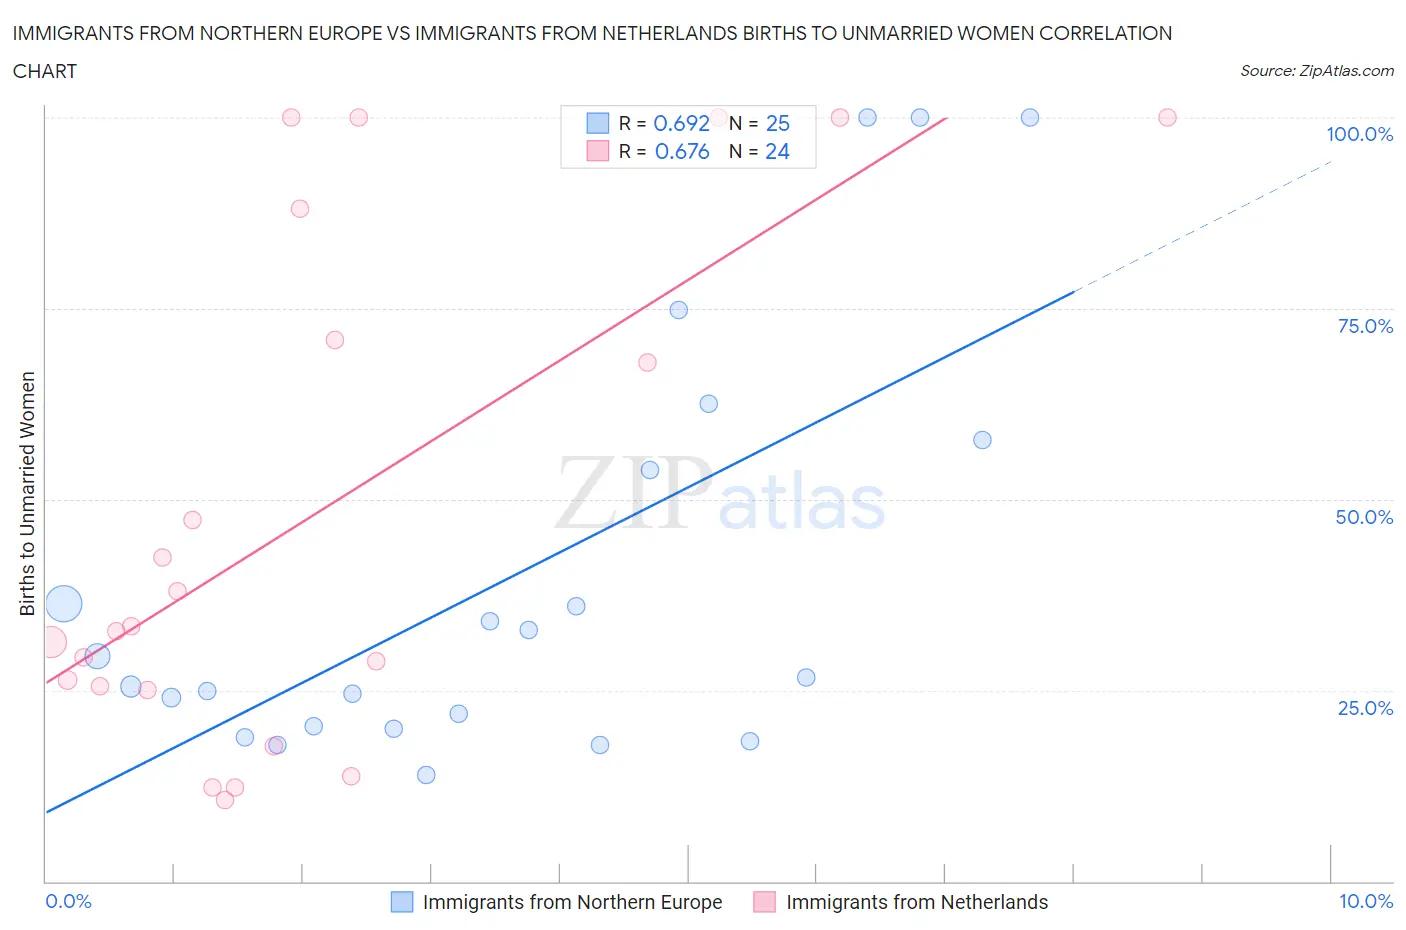
Immigrants from Northern Europe vs Immigrants from Netherlands Births to Unmarried Women Correlation Chart
The statistical analysis conducted on geographies consisting of 435,574,051 people shows a significant positive correlation between the proportion of Immigrants from Northern Europe and percentage of births to unmarried women in the United States with a correlation coefficient (R) of 0.692 and weighted average of 28.6%. Similarly, the statistical analysis conducted on geographies consisting of 223,807,985 people shows a significant positive correlation between the proportion of Immigrants from Netherlands and percentage of births to unmarried women in the United States with a correlation coefficient (R) of 0.676 and weighted average of 29.9%, a difference of 4.5%.
Births to Unmarried Women Correlation Summary
| Measurement | Immigrants from Northern Europe | Immigrants from Netherlands |
| Minimum | 14.0% | 10.7% |
| Maximum | 100.0% | 100.0% |
| Range | 86.0% | 89.3% |
| Mean | 39.7% | 48.1% |
| Median | 26.6% | 33.1% |
| Interquartile 25% (IQ1) | 20.1% | 25.2% |
| Interquartile 75% (IQ3) | 55.9% | 79.5% |
| Interquartile Range (IQR) | 35.7% | 54.3% |
| Standard Deviation (Sample) | 27.4% | 33.1% |
| Standard Deviation (Population) | 26.9% | 32.4% |
Similar Demographics by Births to Unmarried Women
Demographics Similar to Immigrants from Northern Europe by Births to Unmarried Women
In terms of births to unmarried women, the demographic groups most similar to Immigrants from Northern Europe are Zimbabwean (28.7%, a difference of 0.16%), Israeli (28.6%, a difference of 0.19%), Danish (28.7%, a difference of 0.19%), Immigrants from Switzerland (28.6%, a difference of 0.21%), and Immigrants from Afghanistan (28.7%, a difference of 0.21%).
| Demographics | Rating | Rank | Births to Unmarried Women |
| Laotians | 98.6 /100 | #70 | Exceptional 28.5% |
| Jordanians | 98.5 /100 | #71 | Exceptional 28.5% |
| Immigrants | Sweden | 98.5 /100 | #72 | Exceptional 28.5% |
| Albanians | 98.5 /100 | #73 | Exceptional 28.5% |
| Immigrants | Bolivia | 98.5 /100 | #74 | Exceptional 28.6% |
| Immigrants | Switzerland | 98.4 /100 | #75 | Exceptional 28.6% |
| Israelis | 98.4 /100 | #76 | Exceptional 28.6% |
| Immigrants | Northern Europe | 98.3 /100 | #77 | Exceptional 28.6% |
| Zimbabweans | 98.2 /100 | #78 | Exceptional 28.7% |
| Danes | 98.2 /100 | #79 | Exceptional 28.7% |
| Immigrants | Afghanistan | 98.1 /100 | #80 | Exceptional 28.7% |
| Immigrants | Austria | 98.1 /100 | #81 | Exceptional 28.7% |
| Romanians | 98.0 /100 | #82 | Exceptional 28.7% |
| Immigrants | Kuwait | 98.0 /100 | #83 | Exceptional 28.8% |
| Immigrants | Poland | 97.6 /100 | #84 | Exceptional 28.9% |
Demographics Similar to Immigrants from Netherlands by Births to Unmarried Women
In terms of births to unmarried women, the demographic groups most similar to Immigrants from Netherlands are Immigrants from Norway (29.9%, a difference of 0.020%), Argentinean (30.0%, a difference of 0.16%), Immigrants from Italy (29.9%, a difference of 0.21%), Ethiopian (29.8%, a difference of 0.29%), and Immigrants from Croatia (29.8%, a difference of 0.50%).
| Demographics | Rating | Rank | Births to Unmarried Women |
| Immigrants | Ethiopia | 93.4 /100 | #110 | Exceptional 29.7% |
| Immigrants | Hungary | 93.0 /100 | #111 | Exceptional 29.7% |
| Basques | 93.0 /100 | #112 | Exceptional 29.7% |
| Scandinavians | 92.7 /100 | #113 | Exceptional 29.8% |
| Immigrants | Croatia | 92.6 /100 | #114 | Exceptional 29.8% |
| Ethiopians | 91.9 /100 | #115 | Exceptional 29.8% |
| Immigrants | Italy | 91.7 /100 | #116 | Exceptional 29.9% |
| Immigrants | Netherlands | 91.1 /100 | #117 | Exceptional 29.9% |
| Immigrants | Norway | 91.0 /100 | #118 | Exceptional 29.9% |
| Argentineans | 90.5 /100 | #119 | Exceptional 30.0% |
| Ugandans | 89.2 /100 | #120 | Excellent 30.1% |
| Koreans | 88.9 /100 | #121 | Excellent 30.1% |
| Immigrants | Argentina | 88.7 /100 | #122 | Excellent 30.1% |
| Syrians | 88.2 /100 | #123 | Excellent 30.2% |
| Croatians | 88.0 /100 | #124 | Excellent 30.2% |