Immigrants from Northern Europe vs Central American In Labor Force | Age 20-64
COMPARE
Immigrants from Northern Europe
Central American
In Labor Force | Age 20-64
In Labor Force | Age 20-64 Comparison
Immigrants from Northern Europe
Central Americans
79.7%
IN LABOR FORCE | AGE 20-64
72.0/ 100
METRIC RATING
152nd/ 347
METRIC RANK
79.1%
IN LABOR FORCE | AGE 20-64
5.9/ 100
METRIC RATING
226th/ 347
METRIC RANK
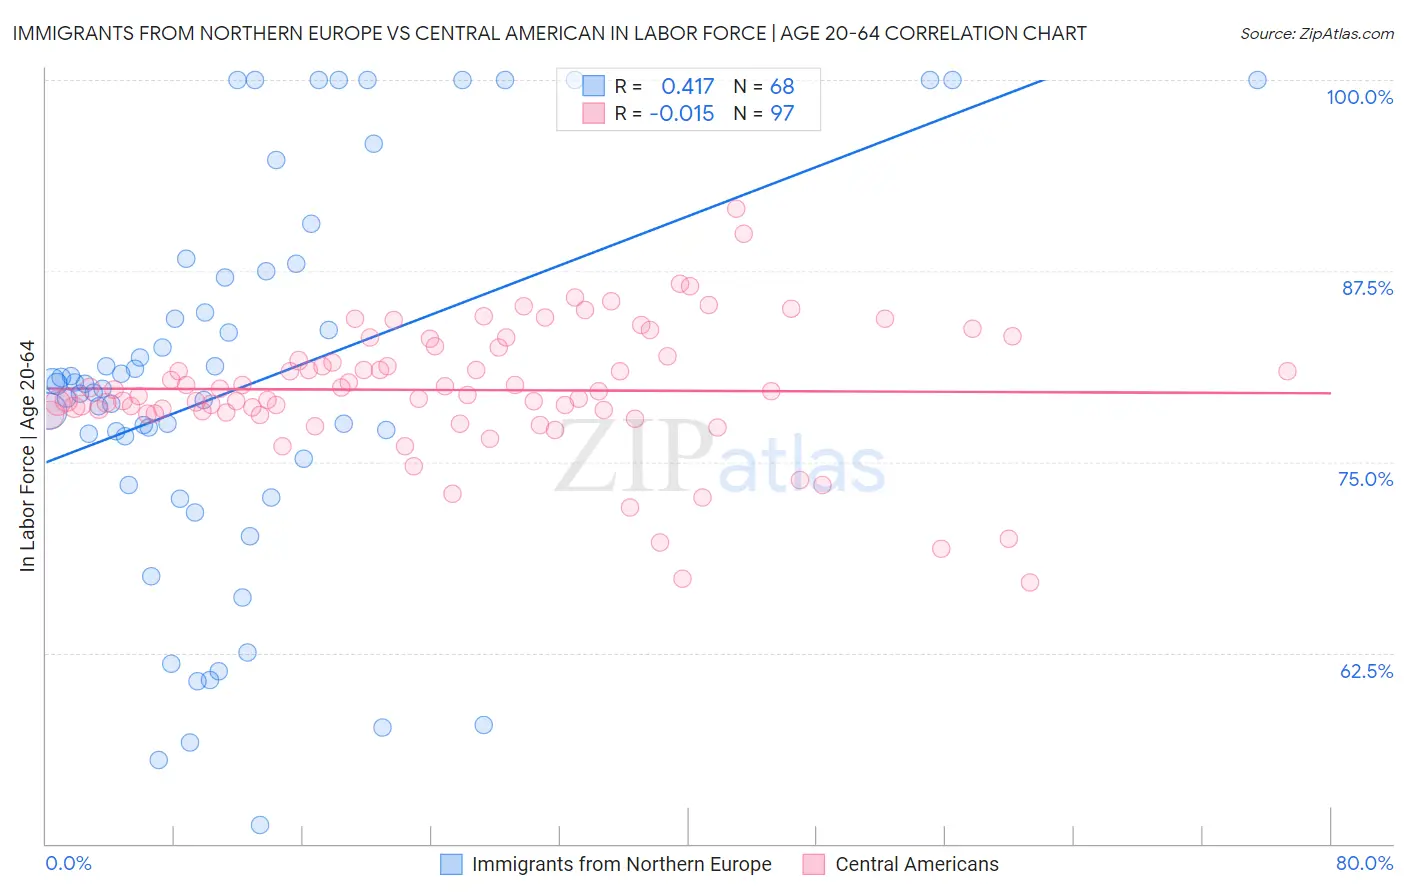
Immigrants from Northern Europe vs Central American In Labor Force | Age 20-64 Correlation Chart
The statistical analysis conducted on geographies consisting of 477,244,131 people shows a moderate positive correlation between the proportion of Immigrants from Northern Europe and labor force participation rate among population between the ages 20 and 64 in the United States with a correlation coefficient (R) of 0.417 and weighted average of 79.7%. Similarly, the statistical analysis conducted on geographies consisting of 504,611,399 people shows no correlation between the proportion of Central Americans and labor force participation rate among population between the ages 20 and 64 in the United States with a correlation coefficient (R) of -0.015 and weighted average of 79.1%, a difference of 0.75%.
In Labor Force | Age 20-64 Correlation Summary
| Measurement | Immigrants from Northern Europe | Central American |
| Minimum | 51.2% | 67.1% |
| Maximum | 100.0% | 91.6% |
| Range | 48.8% | 24.5% |
| Mean | 80.1% | 79.7% |
| Median | 79.9% | 79.6% |
| Interquartile 25% (IQ1) | 74.4% | 78.2% |
| Interquartile 75% (IQ3) | 87.3% | 82.2% |
| Interquartile Range (IQR) | 12.9% | 4.0% |
| Standard Deviation (Sample) | 12.7% | 4.3% |
| Standard Deviation (Population) | 12.6% | 4.2% |
Similar Demographics by In Labor Force | Age 20-64
Demographics Similar to Immigrants from Northern Europe by In Labor Force | Age 20-64
In terms of in labor force | age 20-64, the demographic groups most similar to Immigrants from Northern Europe are Costa Rican (79.7%, a difference of 0.0%), Scandinavian (79.7%, a difference of 0.0%), Immigrants from Kazakhstan (79.7%, a difference of 0.020%), New Zealander (79.7%, a difference of 0.020%), and Icelander (79.7%, a difference of 0.030%).
| Demographics | Rating | Rank | In Labor Force | Age 20-64 |
| Pakistanis | 79.3 /100 | #145 | Good 79.8% |
| Immigrants | Southern Europe | 78.9 /100 | #146 | Good 79.8% |
| Immigrants | Philippines | 78.0 /100 | #147 | Good 79.8% |
| Romanians | 77.6 /100 | #148 | Good 79.8% |
| Icelanders | 75.1 /100 | #149 | Good 79.7% |
| Costa Ricans | 72.4 /100 | #150 | Good 79.7% |
| Scandinavians | 72.0 /100 | #151 | Good 79.7% |
| Immigrants | Northern Europe | 72.0 /100 | #152 | Good 79.7% |
| Immigrants | Kazakhstan | 69.5 /100 | #153 | Good 79.7% |
| New Zealanders | 69.4 /100 | #154 | Good 79.7% |
| Immigrants | South Africa | 69.2 /100 | #155 | Good 79.7% |
| Senegalese | 69.1 /100 | #156 | Good 79.7% |
| Immigrants | China | 69.1 /100 | #157 | Good 79.7% |
| Austrians | 67.6 /100 | #158 | Good 79.7% |
| Immigrants | Cuba | 66.7 /100 | #159 | Good 79.7% |
Demographics Similar to Central Americans by In Labor Force | Age 20-64
In terms of in labor force | age 20-64, the demographic groups most similar to Central Americans are Immigrants from Western Europe (79.1%, a difference of 0.0%), Panamanian (79.1%, a difference of 0.010%), Alsatian (79.1%, a difference of 0.010%), Native Hawaiian (79.1%, a difference of 0.010%), and Portuguese (79.1%, a difference of 0.020%).
| Demographics | Rating | Rank | In Labor Force | Age 20-64 |
| French Canadians | 8.4 /100 | #219 | Tragic 79.2% |
| Immigrants | Immigrants | 7.7 /100 | #220 | Tragic 79.2% |
| Hungarians | 7.2 /100 | #221 | Tragic 79.2% |
| Immigrants | Panama | 6.9 /100 | #222 | Tragic 79.1% |
| Canadians | 6.8 /100 | #223 | Tragic 79.1% |
| Immigrants | Uzbekistan | 6.8 /100 | #224 | Tragic 79.1% |
| Portuguese | 6.4 /100 | #225 | Tragic 79.1% |
| Central Americans | 5.9 /100 | #226 | Tragic 79.1% |
| Immigrants | Western Europe | 5.9 /100 | #227 | Tragic 79.1% |
| Panamanians | 5.7 /100 | #228 | Tragic 79.1% |
| Alsatians | 5.7 /100 | #229 | Tragic 79.1% |
| Native Hawaiians | 5.6 /100 | #230 | Tragic 79.1% |
| Lebanese | 5.1 /100 | #231 | Tragic 79.1% |
| Guamanians/Chamorros | 4.5 /100 | #232 | Tragic 79.1% |
| Japanese | 4.0 /100 | #233 | Tragic 79.1% |