Immigrants from North America vs Nigerian In Labor Force | Age 16-19
COMPARE
Immigrants from North America
Nigerian
In Labor Force | Age 16-19
In Labor Force | Age 16-19 Comparison
Immigrants from North America
Nigerians
38.9%
IN LABOR FORCE | AGE 16-19
99.4/ 100
METRIC RATING
95th/ 347
METRIC RANK
36.1%
IN LABOR FORCE | AGE 16-19
24.6/ 100
METRIC RATING
194th/ 347
METRIC RANK
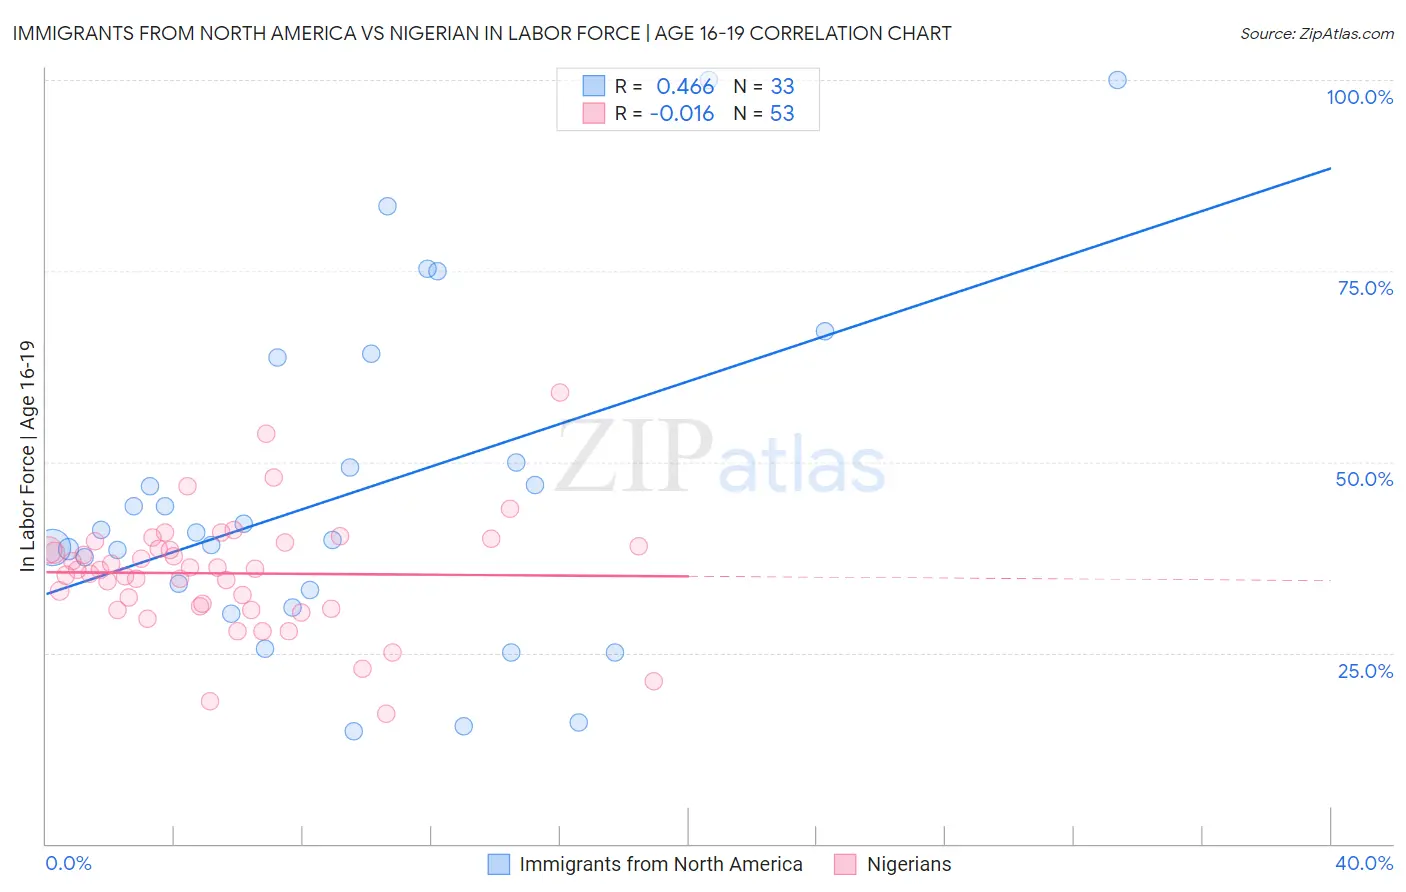
Immigrants from North America vs Nigerian In Labor Force | Age 16-19 Correlation Chart
The statistical analysis conducted on geographies consisting of 461,140,424 people shows a moderate positive correlation between the proportion of Immigrants from North America and labor force participation rate among population between the ages 16 and 19 in the United States with a correlation coefficient (R) of 0.466 and weighted average of 38.9%. Similarly, the statistical analysis conducted on geographies consisting of 332,555,349 people shows no correlation between the proportion of Nigerians and labor force participation rate among population between the ages 16 and 19 in the United States with a correlation coefficient (R) of -0.016 and weighted average of 36.1%, a difference of 7.9%.
In Labor Force | Age 16-19 Correlation Summary
| Measurement | Immigrants from North America | Nigerian |
| Minimum | 14.7% | 17.0% |
| Maximum | 100.0% | 59.1% |
| Range | 85.3% | 42.1% |
| Mean | 45.9% | 35.4% |
| Median | 40.7% | 35.9% |
| Interquartile 25% (IQ1) | 32.1% | 31.0% |
| Interquartile 75% (IQ3) | 56.8% | 39.2% |
| Interquartile Range (IQR) | 24.7% | 8.2% |
| Standard Deviation (Sample) | 21.9% | 7.5% |
| Standard Deviation (Population) | 21.6% | 7.5% |
Similar Demographics by In Labor Force | Age 16-19
Demographics Similar to Immigrants from North America by In Labor Force | Age 16-19
In terms of in labor force | age 16-19, the demographic groups most similar to Immigrants from North America are Latvian (38.9%, a difference of 0.030%), Greek (38.9%, a difference of 0.070%), Ugandan (38.9%, a difference of 0.080%), Blackfeet (38.9%, a difference of 0.090%), and Immigrants from Canada (38.9%, a difference of 0.090%).
| Demographics | Rating | Rank | In Labor Force | Age 16-19 |
| Puget Sound Salish | 99.6 /100 | #88 | Exceptional 39.1% |
| Alaska Natives | 99.6 /100 | #89 | Exceptional 39.1% |
| Immigrants | Burma/Myanmar | 99.5 /100 | #90 | Exceptional 39.0% |
| Spanish Americans | 99.5 /100 | #91 | Exceptional 39.0% |
| Osage | 99.4 /100 | #92 | Exceptional 39.0% |
| Blackfeet | 99.4 /100 | #93 | Exceptional 38.9% |
| Immigrants | Canada | 99.4 /100 | #94 | Exceptional 38.9% |
| Immigrants | North America | 99.4 /100 | #95 | Exceptional 38.9% |
| Latvians | 99.4 /100 | #96 | Exceptional 38.9% |
| Greeks | 99.3 /100 | #97 | Exceptional 38.9% |
| Ugandans | 99.3 /100 | #98 | Exceptional 38.9% |
| Immigrants | North Macedonia | 99.3 /100 | #99 | Exceptional 38.9% |
| Immigrants | Thailand | 99.1 /100 | #100 | Exceptional 38.7% |
| Hmong | 99.1 /100 | #101 | Exceptional 38.7% |
| Zimbabweans | 99.1 /100 | #102 | Exceptional 38.7% |
Demographics Similar to Nigerians by In Labor Force | Age 16-19
In terms of in labor force | age 16-19, the demographic groups most similar to Nigerians are Immigrants from Denmark (36.1%, a difference of 0.030%), Afghan (36.1%, a difference of 0.070%), Bolivian (36.0%, a difference of 0.090%), Immigrants from Croatia (36.1%, a difference of 0.19%), and Panamanian (36.1%, a difference of 0.26%).
| Demographics | Rating | Rank | In Labor Force | Age 16-19 |
| Immigrants | Afghanistan | 34.0 /100 | #187 | Fair 36.3% |
| Immigrants | Europe | 31.8 /100 | #188 | Fair 36.2% |
| Immigrants | Hungary | 28.8 /100 | #189 | Fair 36.2% |
| Panamanians | 28.6 /100 | #190 | Fair 36.1% |
| Immigrants | Croatia | 27.5 /100 | #191 | Fair 36.1% |
| Afghans | 25.7 /100 | #192 | Fair 36.1% |
| Immigrants | Denmark | 25.0 /100 | #193 | Fair 36.1% |
| Nigerians | 24.6 /100 | #194 | Fair 36.1% |
| Bolivians | 23.3 /100 | #195 | Fair 36.0% |
| Mexican American Indians | 21.1 /100 | #196 | Fair 36.0% |
| Immigrants | Serbia | 21.0 /100 | #197 | Fair 36.0% |
| Immigrants | Northern Africa | 19.9 /100 | #198 | Poor 35.9% |
| Immigrants | Norway | 19.8 /100 | #199 | Poor 35.9% |
| Immigrants | Sweden | 18.8 /100 | #200 | Poor 35.9% |
| Alsatians | 17.5 /100 | #201 | Poor 35.9% |