Immigrants from North America vs French Canadian In Labor Force | Age 20-64
COMPARE
Immigrants from North America
French Canadian
In Labor Force | Age 20-64
In Labor Force | Age 20-64 Comparison
Immigrants from North America
French Canadians
79.0%
IN LABOR FORCE | AGE 20-64
2.9/ 100
METRIC RATING
237th/ 347
METRIC RANK
79.2%
IN LABOR FORCE | AGE 20-64
8.4/ 100
METRIC RATING
219th/ 347
METRIC RANK
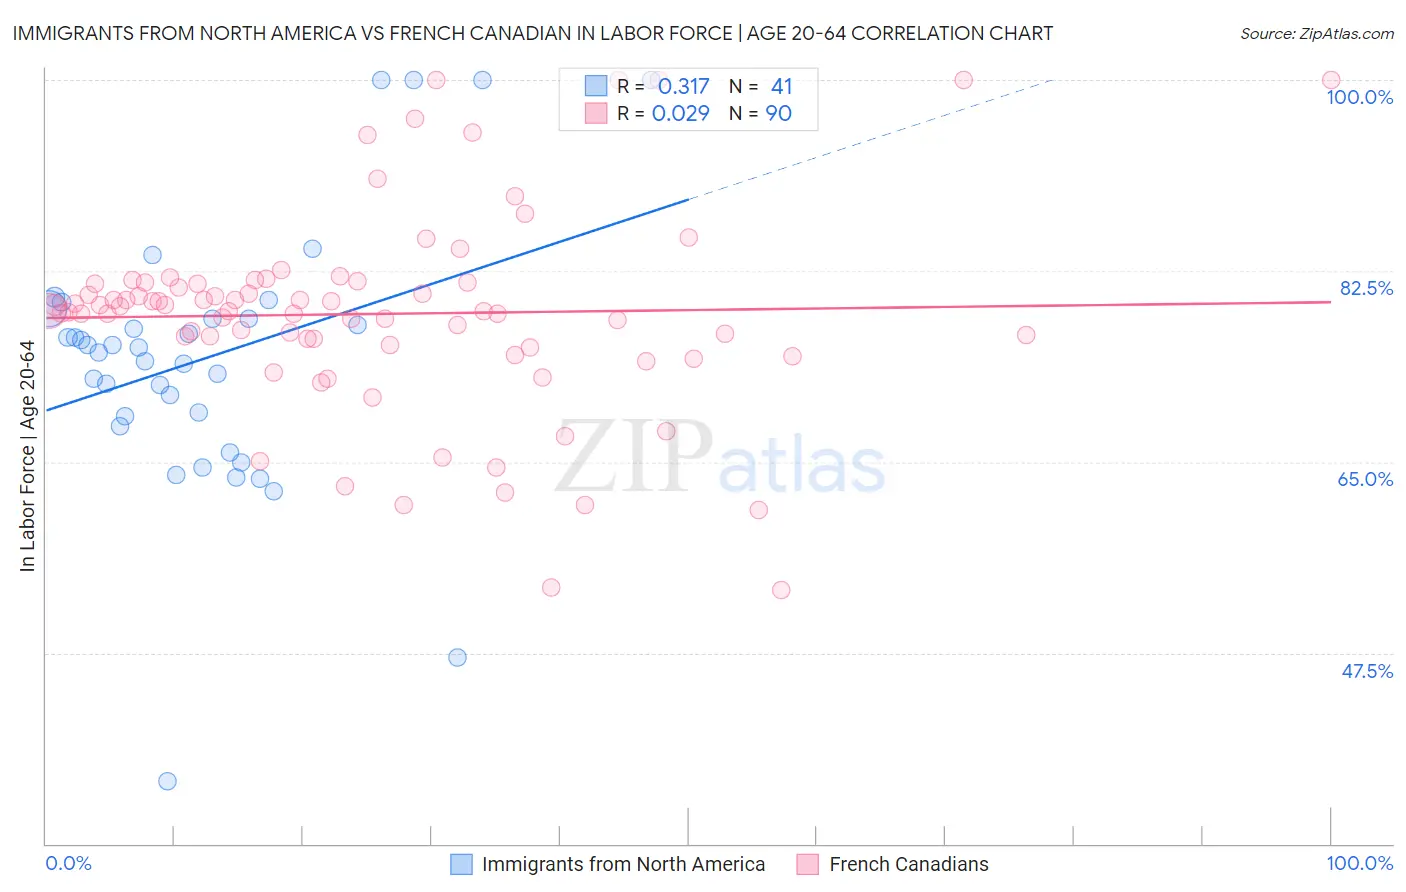
Immigrants from North America vs French Canadian In Labor Force | Age 20-64 Correlation Chart
The statistical analysis conducted on geographies consisting of 462,473,604 people shows a mild positive correlation between the proportion of Immigrants from North America and labor force participation rate among population between the ages 20 and 64 in the United States with a correlation coefficient (R) of 0.317 and weighted average of 79.0%. Similarly, the statistical analysis conducted on geographies consisting of 502,678,468 people shows no correlation between the proportion of French Canadians and labor force participation rate among population between the ages 20 and 64 in the United States with a correlation coefficient (R) of 0.029 and weighted average of 79.2%, a difference of 0.23%.
In Labor Force | Age 20-64 Correlation Summary
| Measurement | Immigrants from North America | French Canadian |
| Minimum | 35.8% | 53.3% |
| Maximum | 100.0% | 100.0% |
| Range | 64.2% | 46.7% |
| Mean | 74.5% | 78.6% |
| Median | 75.5% | 78.8% |
| Interquartile 25% (IQ1) | 68.7% | 75.7% |
| Interquartile 75% (IQ3) | 78.6% | 81.4% |
| Interquartile Range (IQR) | 9.8% | 5.7% |
| Standard Deviation (Sample) | 12.3% | 9.3% |
| Standard Deviation (Population) | 12.2% | 9.2% |
Demographics Similar to Immigrants from North America and French Canadians by In Labor Force | Age 20-64
In terms of in labor force | age 20-64, the demographic groups most similar to Immigrants from North America are Samoan (79.0%, a difference of 0.0%), Immigrants from Canada (79.0%, a difference of 0.020%), Tlingit-Haida (79.0%, a difference of 0.020%), Immigrants from Jamaica (79.0%, a difference of 0.020%), and Japanese (79.1%, a difference of 0.070%). Similarly, the demographic groups most similar to French Canadians are Immigrants from England (79.2%, a difference of 0.020%), Immigrants (79.2%, a difference of 0.020%), Hungarian (79.2%, a difference of 0.030%), Immigrants from Panama (79.1%, a difference of 0.040%), and Canadian (79.1%, a difference of 0.040%).
| Demographics | Rating | Rank | In Labor Force | Age 20-64 |
| Immigrants | England | 9.3 /100 | #218 | Tragic 79.2% |
| French Canadians | 8.4 /100 | #219 | Tragic 79.2% |
| Immigrants | Immigrants | 7.7 /100 | #220 | Tragic 79.2% |
| Hungarians | 7.2 /100 | #221 | Tragic 79.2% |
| Immigrants | Panama | 6.9 /100 | #222 | Tragic 79.1% |
| Canadians | 6.8 /100 | #223 | Tragic 79.1% |
| Immigrants | Uzbekistan | 6.8 /100 | #224 | Tragic 79.1% |
| Portuguese | 6.4 /100 | #225 | Tragic 79.1% |
| Central Americans | 5.9 /100 | #226 | Tragic 79.1% |
| Immigrants | Western Europe | 5.9 /100 | #227 | Tragic 79.1% |
| Panamanians | 5.7 /100 | #228 | Tragic 79.1% |
| Alsatians | 5.7 /100 | #229 | Tragic 79.1% |
| Native Hawaiians | 5.6 /100 | #230 | Tragic 79.1% |
| Lebanese | 5.1 /100 | #231 | Tragic 79.1% |
| Guamanians/Chamorros | 4.5 /100 | #232 | Tragic 79.1% |
| Japanese | 4.0 /100 | #233 | Tragic 79.1% |
| Immigrants | Canada | 3.2 /100 | #234 | Tragic 79.0% |
| Tlingit-Haida | 3.2 /100 | #235 | Tragic 79.0% |
| Samoans | 2.9 /100 | #236 | Tragic 79.0% |
| Immigrants | North America | 2.9 /100 | #237 | Tragic 79.0% |
| Immigrants | Jamaica | 2.6 /100 | #238 | Tragic 79.0% |