Cherokee vs Nonimmigrants In Labor Force | Age 35-44
COMPARE
Cherokee
Nonimmigrants
In Labor Force | Age 35-44
In Labor Force | Age 35-44 Comparison
Cherokee
Nonimmigrants
81.4%
IN LABOR FORCE | AGE 35-44
0.0/ 100
METRIC RATING
317th/ 347
METRIC RANK
83.2%
IN LABOR FORCE | AGE 35-44
0.0/ 100
METRIC RATING
274th/ 347
METRIC RANK
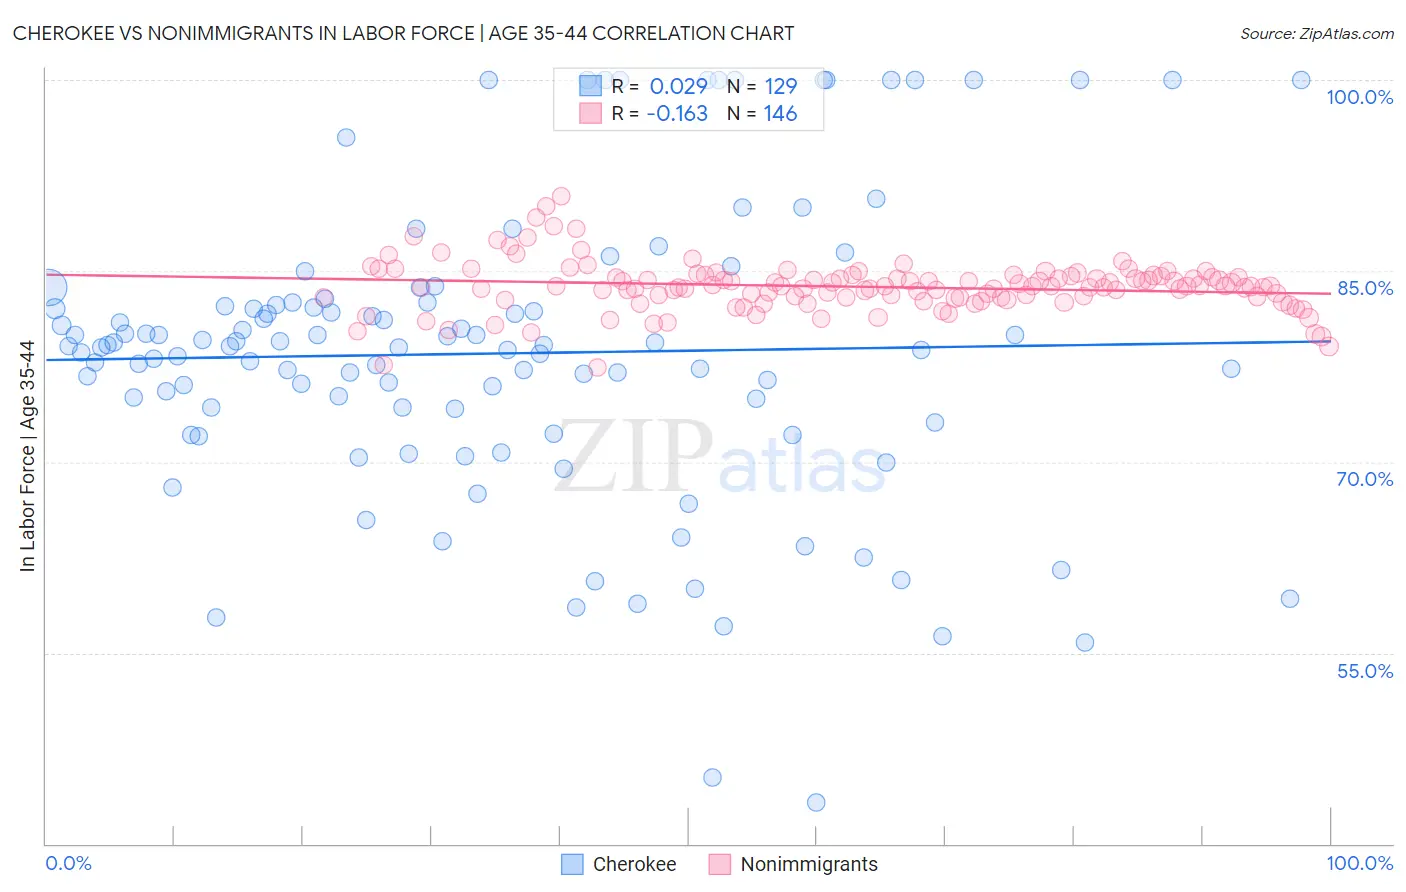
Cherokee vs Nonimmigrants In Labor Force | Age 35-44 Correlation Chart
The statistical analysis conducted on geographies consisting of 493,377,854 people shows no correlation between the proportion of Cherokee and labor force participation rate among population between the ages 35 and 44 in the United States with a correlation coefficient (R) of 0.029 and weighted average of 81.4%. Similarly, the statistical analysis conducted on geographies consisting of 584,065,526 people shows a poor negative correlation between the proportion of Nonimmigrants and labor force participation rate among population between the ages 35 and 44 in the United States with a correlation coefficient (R) of -0.163 and weighted average of 83.2%, a difference of 2.2%.
In Labor Force | Age 35-44 Correlation Summary
| Measurement | Cherokee | Nonimmigrants |
| Minimum | 43.2% | 77.4% |
| Maximum | 100.0% | 90.8% |
| Range | 56.8% | 13.4% |
| Mean | 78.5% | 83.8% |
| Median | 79.1% | 83.8% |
| Interquartile 25% (IQ1) | 73.6% | 82.9% |
| Interquartile 75% (IQ3) | 82.4% | 84.6% |
| Interquartile Range (IQR) | 8.8% | 1.7% |
| Standard Deviation (Sample) | 11.6% | 2.0% |
| Standard Deviation (Population) | 11.6% | 2.0% |
Similar Demographics by In Labor Force | Age 35-44
Demographics Similar to Cherokee by In Labor Force | Age 35-44
In terms of in labor force | age 35-44, the demographic groups most similar to Cherokee are Comanche (81.5%, a difference of 0.080%), Immigrants from Mexico (81.5%, a difference of 0.10%), Alaskan Athabascan (81.3%, a difference of 0.12%), Cajun (81.5%, a difference of 0.13%), and Alaska Native (81.6%, a difference of 0.24%).
| Demographics | Rating | Rank | In Labor Force | Age 35-44 |
| Blackfeet | 0.0 /100 | #310 | Tragic 81.9% |
| Colville | 0.0 /100 | #311 | Tragic 81.7% |
| Alaska Natives | 0.0 /100 | #312 | Tragic 81.6% |
| Mexicans | 0.0 /100 | #313 | Tragic 81.6% |
| Cajuns | 0.0 /100 | #314 | Tragic 81.5% |
| Immigrants | Mexico | 0.0 /100 | #315 | Tragic 81.5% |
| Comanche | 0.0 /100 | #316 | Tragic 81.5% |
| Cherokee | 0.0 /100 | #317 | Tragic 81.4% |
| Alaskan Athabascans | 0.0 /100 | #318 | Tragic 81.3% |
| Inupiat | 0.0 /100 | #319 | Tragic 80.9% |
| Chickasaw | 0.0 /100 | #320 | Tragic 80.9% |
| Puerto Ricans | 0.0 /100 | #321 | Tragic 80.7% |
| Paiute | 0.0 /100 | #322 | Tragic 80.6% |
| Yaqui | 0.0 /100 | #323 | Tragic 80.5% |
| Choctaw | 0.0 /100 | #324 | Tragic 80.5% |
Demographics Similar to Nonimmigrants by In Labor Force | Age 35-44
In terms of in labor force | age 35-44, the demographic groups most similar to Nonimmigrants are Immigrants from Fiji (83.2%, a difference of 0.020%), Spanish (83.2%, a difference of 0.020%), Hawaiian (83.2%, a difference of 0.020%), Delaware (83.2%, a difference of 0.030%), and Samoan (83.2%, a difference of 0.030%).
| Demographics | Rating | Rank | In Labor Force | Age 35-44 |
| Guamanians/Chamorros | 0.1 /100 | #267 | Tragic 83.4% |
| Hondurans | 0.1 /100 | #268 | Tragic 83.4% |
| Immigrants | Grenada | 0.1 /100 | #269 | Tragic 83.3% |
| Immigrants | Honduras | 0.0 /100 | #270 | Tragic 83.3% |
| French American Indians | 0.0 /100 | #271 | Tragic 83.2% |
| Immigrants | Fiji | 0.0 /100 | #272 | Tragic 83.2% |
| Spanish | 0.0 /100 | #273 | Tragic 83.2% |
| Immigrants | Nonimmigrants | 0.0 /100 | #274 | Tragic 83.2% |
| Hawaiians | 0.0 /100 | #275 | Tragic 83.2% |
| Delaware | 0.0 /100 | #276 | Tragic 83.2% |
| Samoans | 0.0 /100 | #277 | Tragic 83.2% |
| Belizeans | 0.0 /100 | #278 | Tragic 83.1% |
| Immigrants | Micronesia | 0.0 /100 | #279 | Tragic 83.1% |
| Dominicans | 0.0 /100 | #280 | Tragic 83.1% |
| Guatemalans | 0.0 /100 | #281 | Tragic 83.0% |